This Flash animation was produced from a PPT about pythagoras’ result. The presentation will last about 20 minutes including the mini-exercises within the animation. It leads to a homework sheet and practice examples for a test.
This Flash animation was produced from a PPT about areas of circles, and those area problems where you have half a circle added to rectangle and so on. The presentation will last about 10 to 15 minutes including the mini-exercises within the animation. It leads to a homework sheet and practice examples for a test.
This is one of a series on shape and space for an Access GCSE Maths Equivalent course. As mentioned below, to ensure that the Flash export from Open Office 2.0 produces the builds, I need to use separate copies of slides in the PowerPoint where I would normally use a ‘custom animation’ build. I have also had to re-type the formulas produced using MS Equation Editor in the original PPT file – I think this is happening when I resize formulas; the resize instructions appear to be misinterpreted by the OpenOffice formula editor.
This animation includes a few exercises with answers revealed later and I have added hints for the last set of questions. This makes the animation ‘stand alone’ in the sense that there is some chance for readers to interact with the maths and try calculating the answers.
This Flash animation was produced from a PPT about areas of rectangles, parallelograms and triangles. The presentation will last about 10 to 15 minutes including the mini-exercises on a separate handout. I’ll probably use the animations at a larger canvas size than the 400 by 300 I’m using here for the course support site.
I’m having to use copied slides to make builds rather than the more intuitive ‘custom animation’ within PowerPoint 2004 because the OpenOffice flash export ignores custom animation; you just end up with the final view of the slide.
I’d put this presentation at Numeracy Core level 1 and possibly 2 although I have built in ideas that could go further. I find that the circles and composite shapes sections take more time (they will be in a separate flash animation coming soon). Most people can get their head around the basic formulas.
The image of Edgbaston Reservoir comes from Google Earth – I’m leaving the copyright on the image so people know the source.
More recent images as soon as the films get processed (yup – that bit where you coat acetate with a thin emulsion of silver chloride salts and dyes mixed with gelatin).
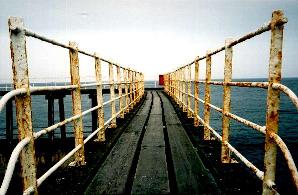
As a taster – the East side break water bridge you are now viewing was swept away sometime in the last three years….
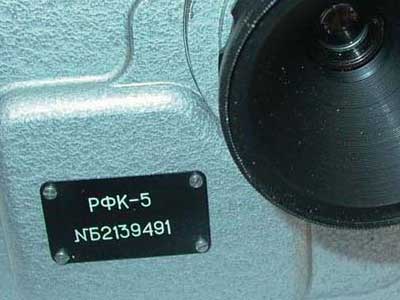
One throw-away comment as the proud proprietor was demonstrating his projection room: 1600 watts of light – each 1/24th of a second, a 35mm movie film frame gets 1.6 Kw of light passed through it, I guess in four blasts as most film projectors use a ‘maltese cross’ arrangement to chop the 1/24th of a second into 1/96th of a second to reduce flicker.
A movie film frame sits horizontally across the film (18mm by 24mm) so that is something like 3.7 watts per square millimetre of film stock, or around 154 milli-Joules of light energy for each square millimetre of film. Serious heat – no wonder they need infra-red filters.
This Flash animation was produced from a PPT about perimeters and circles. The presentation will last about 30 minutes including the mini-exercises. I’ll probably use the animations at a larger canvas size than the 400 by 300 I’m using here.