January 28th, 2006
Nice and clear site on stats for genetics by Jim Deacon from the Biology Teaching Organisation, University of Edinburgh. Useful examples in context and helpful dos and don’ts. There is a section on experimental design as well, and a page that helps people choose the appropriate statistical test.
Posted in Maths | Comments Off
January 24th, 2006
The R Project provides the R ‘statistical environment’ – a command driven statistical calculator with considerable graphics capability and plenty of routines. The ‘commands’ are actually part of a full programming language for doing statistics so entire applications can be built within the environment.
The R software is Open Source (capital OS) and pre-compiled binaries can be downloaded for Mac OS X, Windows and various flavours of Linux. I have downloaded all 40Mb of the Mac OS .dmg version so I can create some effective graphs and charts.
Posted in Maths, Notes | Comments Off
January 21st, 2006
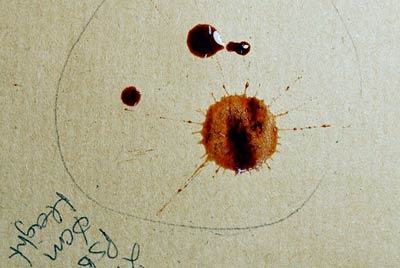
As one of the students said after the practical work “I’m really glad we are doing practical work in Maths – I could never see the point before”. The simulated blood stain experiment is used to test the theoretical relationship between the semi-major and semi-minor axes of an ellipse fitted to the blood stain and the angle of impact of the blood droplet with a surface. We use simulated blood consisting of a mixture of milk, treacle and a bit of food colouring to improve contrast.
The main part of the write-up is to analyse the quantitative errors on the various measurements of the width and length of the blood stain and the angle of the board that the paper surface was pinned to. The results for a range of angles are plotted as a scatter diagram and the results are quite close in the middle range (20 to 70 degrees) but the errors get serious at very high angles of impact (drop at near 90 degrees to paper – stains almost circular) and for very low angles of impact (drop at 10 degrees to paper – stains very streaky and running down surface). You very quickly realise that the errors in measurement are quite small for moderate angles – around 0.2 degrees if you measure the angle of the board using height and hypotenuse rather than fiddling with protractors.
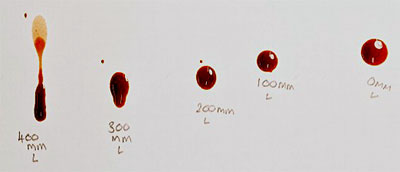
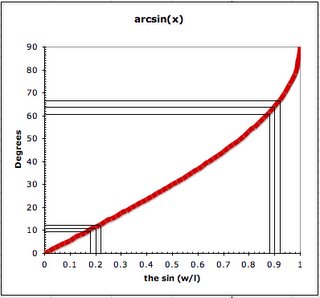
Qualitative factors such as surface properties come to light. Students control for the height at which the blood drop was allowed to fall on the surface, and we use a range of surfaces (art paper, rough brown paper, I don’t use the paper towels any more as they absorb the mock-blood at different rates against or along the ‘grain’). The error from measurements used to find the W/L ratio for each ellipse is ‘amplified’ at large values of impact angle as a result of the steepening gradient of the sin-1(W/L) graph in that region – see the graph below. This introduces the idea of ‘rate of change’ nicely.
I have had a lot of mileage from this simple experiment (usually takes about 90 minutes to agree method and take results. The mock bloodstains need a few days to dry out enough to measure. I put them in A4 polypockets after a week – they can be scanned through the polypockets).
Posted in Forensic, Maths | Comments Off
January 19th, 2006
Each person shakes hands with every other person in the room. If there are 6 people then there are 15 handshakes. If there are 12 people in the room, there are 66 handshakes.
The Mystic Rose diagram lets you see how to find the formula N * (N-1) /2 that calucates these numbers. The resulting patterns are pleasing to the eye and encourage students to talk about symmetry and pattern. You can download an Excel spreadsheet that will draw rose patterns from 3 to 25 points.
Using with students
- We do the handshakes, and agree that if you and I shake hands that is one handshake
- Then we ask how many people shake hands with you (one less than the number in the room)
- Next, I draw dots on the board to represent a room with (say) six people in it – and I draw lines between all the six people
- We simplify to 2 people (one line) and three people (3 lines) and four people (6 lines)
- I show printouts from the spreadsheet with the first 15 patterns
- We go back to the idea that we all do one less handshake than the number of people in the room as we can’t shake hands with ourselves. Then we say, well, each of us shakes hands with N – 1 people, and then I squeeze out the formula with the final idea that we divide by 2 because of the definition of a handshake.
- I have projected the spreadsheet with a time delay so each line takes a second to draw – and the motion has helped people see what is going on
- With a handout showing the roses up to 15 it gets easier to see the symmetry and relationships in the patterns
- The whole activity is short enough to use as a starter in a lesson – about 15 minutes
The spreadsheet
You can download an Excel spreadsheet that will make drawing the roses up to 25 points easy. The spreadsheet contains a macro written in Visual Basic that does the drawing. See the code for the method.
- Open the spreadsheet and enable macros when asked
- Make sure that the ‘select’ button on the drawing toolbar is not selected
- Click the Rose button to run the macro
- Supply a number of points for the rose (max 25)
- Then say how many printer’s points you want the radius of the diagram to be
- After a second or two, your rose will appear
- Enable the drawing tools toolbar: View | Toolbars | Drawing if it not already enabled
- Click the select arrow and drag a box around the whole rose
- Copy and paste into Word or PowerPoint as needed
- Students can copy and paste into Paint or PaintShop Pro and ‘flood fill’ the spaces in the patterns to make artwork
Posted in Maths | Comments Off
January 18th, 2006
When I start the algebra on level 2 courses, I tend to kick off with substituting into formulas as a link back to the work on (what else?) BODMAS. I add in some of the less logical aspects of the way we write formulas and by bringing in substitution early, the idea of working out tables of values, and the need to work with directed numbers is fixed in the mind. This mini-lesson includes a brief presentation on what substitution does, and then leads into a pairs activity designed to last about 20 minutes. At that point, a ‘traditional’ book exercise is used to fix ideas and provide examples of exam questions.
The pairs activity is based around two sets of cards – print them from the powerPoint files below using the ‘handout’ prining option with ‘6 slides to a page’ set.
One players get a set of formula cards, and the other a set of value cards. The activity results in the result of each formula being calculated by substituting in the values from one or two ‘value’ cards. Students record the formula, the values for X and Y and the result.
The plenary has the students writing the X and Y values and the results on a flipchart, one for each formula. In this way a table of values can be constructed for each of the formulas. Comments and checking allow for review of directed numbers, sequence of operations, powers and indicies.
Posted in Maths | Comments Off
January 16th, 2006
Until Thursday 19th Jan you can download the whole of a 45 minute program about the history of Prime Numbers with contributions from working mathematicians and a historian. There is a handy resources page as well with links to other Web sites and book references, including a recent book by Marcus du Sautoy – one of the contributors. His Shockwaved home page is really quite jazzy actually. The Web site for Music of the Primes has some interesting design on it as well – including a music game driven by prime number sequences.
Melvyn Bragg hosts a radio program called In Our Time that goes out each Thursday morning at 9:00 am on a concept or idea in history. As part of an experiment by the BBC, some of these programs are being made available as MP3 downloads for you to copy to your iPod or MP3 player. The BBC are suggesting that you should listen to the programs within a 7 day period – and that they are for personal use only.
Both Jim and myself logged this venture into podcasting by the BBC and passed the Web address onto colleagues. I hope more programs will become available. I’m working on colleagues to consider producing their own podcasts – why not?
Posted in Maths, Web | Comments Off
January 14th, 2006
Psyllium husk is, apparently, a good source of fibre with anti-oxidant properties . Personally, I shall continue to have porridge once or twice a week!
I couldn’t resist the graphics on this small packet found in my local grocer – a shop that stocks yams, cassava, fruit, veg, baklava, callaloo and just about anything else you want including 5 litre cans of olive oil. The Sidhpur factory has a Web site which looks to have been designed circa 2001. Alas, the Web designer chose not to theme the site using the retro graphics on the packaging. I think someone like Jeffrey Zeldman or Jason Santa Maria would have had a field day with these simple and bold graphic elements.
I think it is the retro look of the 3-colour screen print, together with the bold graphics and the use of a factory chimney and 1920’s vintage telephone to associate the product with ‘modern’ things that fired my curiosity and led to the modest purchase. In the UK, most health food additives use pastoral images in their marketing, even though the products are industrially refined and packaged.
Posted in Notes | Comments Off