You should see a YouTube video of my screen design screencast appear at some point. It took a few minutes to upload the MOV file of the screencast, but seems to be taking much longer to ‘process’ the file.
YouTube provides free hosting and bandwidth so we can’t complain. I want to compare the quality with the home produced version that used Video2SWF as mentioned in the previous post. First impressions are that the quality is higher, in particular, the rendering of drawings is much better.
If all goes to plan, above this text you should see an embedded flash movie player. When you click on the movie, you should see me talking through a PowerPoint presentation that I am ‘presenting’ on my iBook. The PowerPoint presentation was captured as a MOV video file using the iShowU screen capture program from Shiny White Box software. I then used Video2SWF from Vertical Moon software to convert the MOV file to an SWF file and associated html file. The SWF file contains the video and a flash movie player. Both of these programs are ‘try before you buy’ and come to a total cost of $65, around £37 in real money.
The quality loss compared with the original MOV movie file is quite high, especially with the drawn diagrams near the start. I need to play with the various variables involved. Converting from MOV to SWF takes a lot of time on my iBook (half an hour to convert a 10 minute MOV). The MOV file will play in Safari when you follow the link at the beginning of this paragraph, I’m not sure if MOV files can be played through Windows Media Player on Windows XP, or if a QuickTime download is needed.
The next move will be to set up a YouTube account and see if the Web side tools can convert the MOV file with better quality.
There should be an embedded YouTube video above this text. I’ve found some screen capture software for Mac OS X and I am looking at using YouTube to park screencasts based on PowerPoint presentations with commentaries.
The video lasts about 90 seconds and shows the relative scale of Earth, the solar system planets and the galaxy. Harmless, but a lot of the material on YouTube is a bit scuzzy, so I’m looking at self-published alternatives.
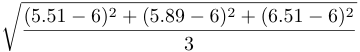
The formula above has to be written as a single line with brackets to ensure that the top line is calculated before the division, and that the square root function applies to the result.
We spent an hour working over examples with recent Casio calculators and using a projected spreadsheet today.
The fraction bar notation used in textbooks has a logic for algebraic fractions because it emphasises the cancellation of common factors. It will take a time for the calculators to catch up fully with the traditional notation – perhaps there will be a compromise part way?
The material is interesting in itself, but I also like the style of the presentation. Many slides of one or two words that summarise the discussion and allow Lessig to talk around the point. This presentation was produced in Keynote, but the sound track had to be added in iMovie after exporting Keynote slides as JPGs. Lessig has explained the method of cutting the duration of the slides to the sound track, and it is tedious, requiring a split and delete-right for each slide. I’m looking at Adobe Capture on a PC as a quicker way of producing works like this – the idea of sound tracks with commentaries is becoming attractive as a way of presenting Maths content over the Web.
PS: I have also realised that I can use an image as the title of a post – although this may have ‘interesting’ consequences for the appearance of archive pages.
MS Excel has default settings that reflect the needs of business students and the preparation of graphs and charts for presentations.
Science students need to use Open Access computers in drop in centres where it may not be possible to alter the defaults. This handout shows students how to…
Enter data and rename the work sheet
Use the chart wizard to plot an XY (Scatter) plot of data
Alter the Plot Area colour from the muddy grey default
Alter the Data marker colours to enhance contrast
Alter the Scale and Marker settings to show Minor tick-marks
Challenge activities include: finding a combination of foreground and background colours for the data markers that will produce crosses, and researching the ‘trendline’ function.