Probability part 2: Tree diagrams
Suppose you have a bag with five red balls and three white balls. You decide to pick two balls from the bag but when you have picked the first ball, you note its colour and replace the ball in the bag for the second pick.
The question might be asked “what is the probability of picking one ball of each colour. but we don’t mind which order the balls are chosen”. You can work out the answer to this question as follows: We have two possible ways of having one ball of each colour: red first then white and white first then red. These outcomes are mutually exclusive in the sense that if you choose your first ball and find the ball to be white, you have excluded the possibility of the red then white outcome, and vice versa. As the two outcomes, red then white and white then red are mutually exclusive, we can add the probabilities of each outcome to find the probability of one ball of each colour.
To calculate the probability of the red AND white outcome, we multiply the probability of red first then white second, treating the choices as independent, giving five eighths times three eighths, or fifteen sixty fourths. Note that the probability of drawing a white ball on the second pick remains three eighths as we have replaced the red ball, more on this later. The probability of white first then red ball second is three eighths multiplied by five eighths for a total of fifteen sixty fourths. Adding the two outcomes gives thirty sixty-fourths or fifteen thirty-seconds as the probability of picking one ball of each colour.
There is a diagram that can show the various outcomes visually and make it easier to pick the outcomes that satisfy a certain condition – the tree diagram. There is always a tree-diagram question on the Data handling paper so this is a useful diagram to learn.
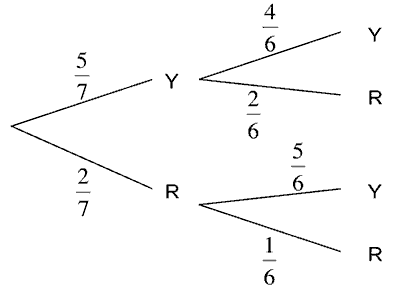
The tree diagram allows you to draw a picture of the whole history of the two picks we are performing. The first pick is symbolised by a branch – notice how the probabilities on each branch always add up to one in the sense that something has to happen. The outcomes of the first branch, symbolised by R for a red ball and W for a white ball each ‘bud’ a new branch for the second pick. From the R outcome, we have a branch leading to a second R and to a W outcome. The probabilities on this branch are the same as the first branch as we are replacing the ball after the first pick. There is also a branch budding from the W outcome on the first branch, and again the probabilities are the same.
We now have a tree that tells the history of the two picks – we can work out the probability of any of the four possible outcomes, namely RR, RW, WR and WW. The rule is to multiply along the route to each desired outcome. The probability of RR is seen to be five eighths multiplied by five eighths, or twenty five sixty-fourths. The other probabilities follow in the same way as fifteen sixty-fourths, fifteen sixty-fourths and nine sixty-fourths. Note that the four outcomes have probabilities that add to one as must be the case.
Each of these paths is mutually exclusive in the sense that they are different paths through the diagram, and we can add the probabilities of different paths.
The rules of a tree diagram can be summarised as follows: the probabilities on the twigs of any particular branch add to one, the probability of a given path through the tree is given by multiplying the probabilities along the path, and different paths are mutually exclusive so their probabilities can be added.
Now suppose we repeated the trial above with two picks of the five red and three white balls, but on this occasion we do not replace the first ball. Our new tree diagram has exactly the same shape as the previous one, and the first branch is identical. But now, the second branch budding from the R outcome will have probabilities of four sevenths for a second red ball R and three sevenths for a white ball W. In the same way, the second branch budding from the W outcome will have the probability of five sevenths for the R outcome, and two sevenths for the W outcome. We can still regard the second pick as ‘independent’ of the first pick because each of the seven balls left in the bag has an equal chance of being picked – the choice of, say, a red ball on the first pick simply reduces the number of red balls available for the second pick, the red ball left out of the bag is not influencing the probabilities on the second pick in any way.
The new probabilities for each path through the tree diagram for this ‘without replacement’ problem can be calculated by multiplying along the path, and the probability of ‘one ball of each colour’ is now given by adding fifteen fifty-sixths for the RW path to fifteen fifty-sixths for the WR path, giving thirty fifty-sixths or fifteen twenty-eighths. This is a slightly higher probability than for the ‘with replacement’ version of the problem, which makes sense as it is less likely that you will pick two reds in a row or two whites in a row in the without replacement game.
Here is a problem for you: Suppose you have nine blue balls and seven green balls. If you pick a ball, keep it out of the bag and then pick a second ball, what is the probability of having chosen at least one green ball at the end of the game?
At least one implies that the outcomes green, blue and blue green and green green are consistent with the condition. There is a shortcut to finding the answer….
Summary
Draw the tree and add the probabilities
Remember that the probabilities in any branch add to one
The probability of any given path through the tree is given by multiplying the probabilities along the path
The probabilities of each path are mutually exclusive and can be added
Your turn
Ex 3 Unit 37
The end


