Adding, subtracting and multiplying easy fractions from (mostly) related families
Four functions on decimal numbers for non-calculator use
We will be spending a good chunk of lesson time on fractions and this homework sheet is designed to provide practice and consolidation for those students who find fractions hard going – so they can see what a typical level 2 test or GCSE exam might involve.
Highest common factor and lowest common multiple of two by ‘common sense’ listing methods
Finding the prime factors of a number
Lowest common multiple and highest common factor of two numbers using a systematic method based on a Venn diagram
Simple logic and Venn diagram based questions are no longer on the GCSE or other level 2 syllabuses unfortunately, but a simple Venn diagram provides such an easy way of explaining how to build the HCF and LCM of two numbers that I feel justified in including it.
The prime factors of a positive whole number represent one of the more abstract bits of basic maths, so I find an immediate application helps students see what the prime factors are for, and helps then avoid the confusion between the prime factors and the ‘ordinary’ factors.
I wrote these questions for homework, but they could be used in a workshop setting or as a quick check at the start of a lesson. Some related posts include
of whole numbers. The bodmas questions assume knowledge of tables.
I’m writing out homework sheets each week, but the questions can be used in workshops and lessons as well. There will be hot potatoes quizzes matching each sheet as well.
The R statistical computation environment is available for free download and is compiled in versions for Mac OS X, Windows and various flavours of Linux.
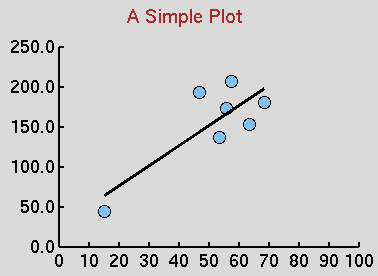
Dong-Yun Kim has provided a ‘getting started’ tutorial for R and the tutorial shows an interesting demo in TCL/TK. A scatter diagram is presented in which you can drag the data points to see the effect on the ‘line of best fit’. My example above shows how a cluster of data points with one pathological point can give a ‘line of best fit’ of almost any slope you want according to the pathological data point coordinates!
I can imagine using a hacked version of this demo (larger canvas, relevant data set) to emphasise the need to plot data before running statistical analyses.
To see this tutorial using the Mac OS version of R, you need to click the X11 toolbar button as the tcl/tk script interpreter needs the X11 window manager to be able to draw graphics to the screen. Then you issue the R commands…
> library(tcltk)
> demo(tkcanvas)
and the scatter diagram window with draggable points appears.
Static graphics are displayed within the Aqua window manager (i.e. Mac OS X) and can be copied and pasted into Preview as PDF files -zoomable and no jagged edges.
Alas, one ‘feature’ of the Mac OS X implementation of R appears to be that the data frame editor does not allow variable names to be edited. More exploration is needed. R may be a little too intimidating for HND first year students, but it is free and can run all the statistical tests they will need. MS Excel has known issues for statistics, and the Office 2007 version for Mac OS X will not include VBA, which, presumably, means no Analysis Toolpack Add-in.
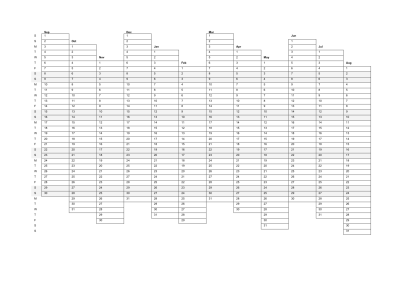
I like my weekends and day names to line up, so I have the months moving in a ‘staircase’ arrangement. I usually print these A3 and use one for each project or course to show assignment deadlines and so on.
The above YouTube was processed from a Quicktime movie exported from KeyNote 08. Just
Put your slides together
Select ‘Record SlideShow’ from the File menu
Talk through your slides (the test used the built in microphone on my iBook with a fan going in the background)
Save the result and export to Quick Time
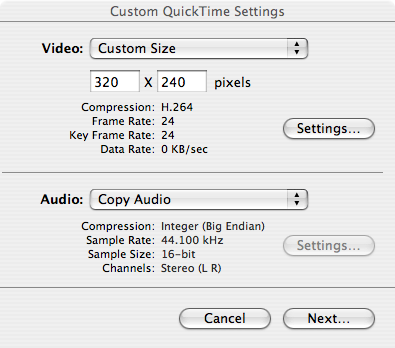
I used the ‘custom’ video option (see below) when exporting to set the video size to 320 by 240, you tube style. You can export at full quality and burn the results to a CD-ROM…
When you record a show, the sound appears to be saved with the KeyNote file (one minute added an extra 1 Mb to the size of the sample Keynote I made with 4 images). There does not appear to be a way of removing the sound once you have added it (I could well be wrong here) but you can re-record the sound as often as you want.
You can download the 30 day trial iWork package (all 450Mb) from Apple. The trial version has Pages, Numbers and Keynote only. The re-written version of iMovie won’t run on my iBook anyway (it needs a G5 upwards and enhanced video). Keynote seems to run fine on my G4 with 512Mb, but I have not done a 70 slide special (yet).
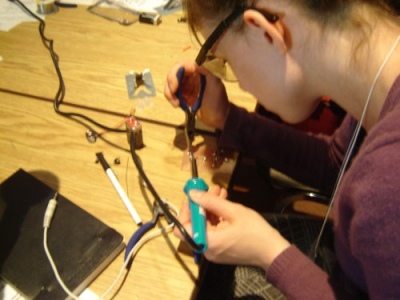
Tetsuo Kogawa holds workshops creating very low power FM transmitters as an empowering skill with young people. This is legal in Japan, but not in the UK
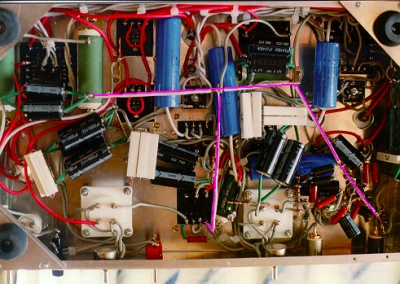
Sakuma develops and uses valve amplifiers and primitive loudspeaker designs in his restaurant to provide music. He places a heavy emphasis on empirical circuit development and has gone back into the history of electronics in the early 20th century to inform his (unusual) practice.
Two ways of doing electronics, one political one personal – almost religious – in Japan. This is a totally different way of looking at electronics from the one I have grown up with in the UK.