Writing about charts

December 16th, 2005
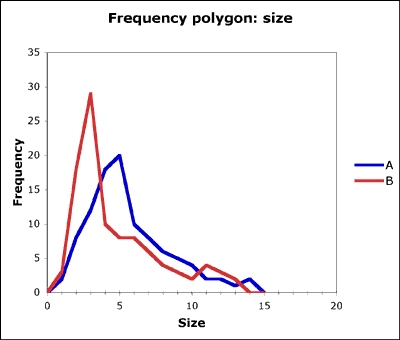
Two contrasting frequency polygons

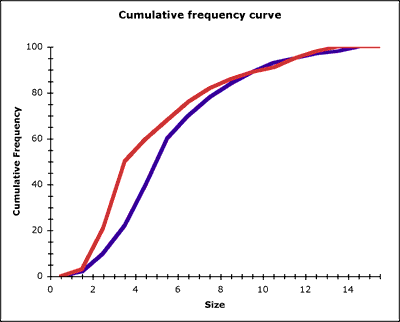
Two contrasting cumulative frequency curves on the same axes

I used an Excel spreadsheet with hotlinked graphs on a projector. Two contrasting frequency polygons led discussion about location (central tendency) and dispersion (spread). As both frequency tables had totals of 100, we could explore the idea that a lower peak means more data in the bins on either side of the peak, and so a more spread out distribution. As the graphs are hotlinked, I could alter frequencies hugely to make points. After plotting polygons based on student data, we looked at constructing a cumulative frequency curve.

Then I projected the cumulative frequency curves drawn from the same frequency distributions used for the polygons. Students had a handout showing all four charts, and we explored the relationship between the sharpness of the peaks on the frequency polygons and the steepness of the gradient on the cumulative frequency curve. This latter point sunk home for one student while plotting the cumulative frequency curve (psychomotor learning or the need for practical action on data?). Later work on interquartile range will reveal the difference in spread between the two distributions. It would probably have been a good idea to force the horizontal scales to match on the projected graphs and on the handouts.

A simple resource that takes minutes to make – no fancy PowerPoints with transition effects – supports two 15 to 20 minute discussions and allows instant follow-up to student questions.
Wikis in school

December 14th, 2005

WikiSchool is a page on meatball wiki about wikis in schools. Wikis are Web server applications of greater or lesser sophistication that allow people to edit and add Web pages. There is more to wikis however, and most of the magic is based on the idea of a WikiWord (usually a word in CamelCase) acting as a link pattern, so that each WikiWord has a page, and quoting the WikiWord on a page automatically generates a link to that page.

100 words

December 11th, 2005

Below is a list of the most common 100 words as reported on the BBC News – based on research by Jonathan Solity and Janet Vousden at Warwick University. The research is aimed at the current debate around the teaching of reading in UK schools, but the research included adult fiction and non-fiction choices as well.

a, about, after, all, am, an, and, are, as, at, away

back, be, because, big, but, by

call, came, can, come, could

did, do, down

for, from

get, go, got

had, has, have, he, her, here, him, his

I, in, into, is, it

last, like, little, live, lookmade, make, me, my

new, next, not, now

of, off, old, on, once, one, other, our, out, over

put

saw, said, see, she, so, some

take, that, the, their, them, then, there, they, this, three, time, to, today, too, two

up, us

very

was, we, were, went, what, when, will, with

you

MP3 interview – Simon Wheatley

December 11th, 2005
  • Simon Wheatley is a recently appointed Magnum photographer – his reportage work inlcudes documenting teenagers in the UK
  • Martin Fuchs is a graphic designer and free-lance photographer and Magnum trainee who has been keeping a New York Photography blog for the past few months
  • Fuchs recently interviewed Simon Wheatley for about 2 hours and editied the material down to about 45 minutes, broken into segments
  • You can download the 11 MP3 files. I did, and burnt them to an audio CD. I’m listening now, and the CD will be given to photography students at the College over christmas
  • I like this idea of DIY interviews – just get a copy of Audacity, and set up some decent microphones and record away direct to the hard drive. Then edit, and release.
  • I wonder what Studs Terkel would have made of all this?

One comment from Thomas Sullivan left on the blog page about the interview ...

“a little long I think. What you asked and what he answered, fine, that’s the framework you created, and his honest answers. But, he tends to hem and haw a bit…personally I would have editted his answers, without changing the thought behind them, to eliminate some of his stumbling and hesitations. 45 minutes of “ummmm”, “well”, “I’m not the person you should ask this”, etc. is all very revealing of his humbleness, and the thought he puts behind his answers, but it only needs to be “published” once or twice for us to get the idea…......after that, just cut that stuff out in the editting room, and leave the guts of the answers. my guess is it would end up to be about a 30 minute interview and pretty fast paced, but not lose anything in the translation….IMHO”
Now, I wonder if editing the MP3s could be set as a homework task?

Planet transit times 2006

December 11th, 2005

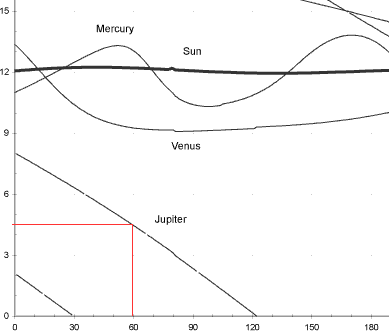
Small part of transit time chart showing transit time for Jupiter in March 2006

A rough and ready way of using the charts to find a planet in the sky is as follows…

Transit time

The circle that runs through the zenith and the point on your horizon that is due south of your position is called your Meridian. The time at which a star or planet crosses the Meridian in the south is called the transit time for that star. The transit time chart tells you the transit times for the planets and the Sun for 2006. Starts (and planets) rise in the East and set in the West, and knowing the transit time for a planet can tell you roughly where to look for it at any given time.

In the example shown in the diagram above, the transit time for Jupiter around the beginning of March 2006 is 0430 local time or 7.5 hours before the Sun transits. This means that Jupiter will rise 7.5 hours before the Sun as well, and will be visible over most of the late evening or early hours of the morning.

Suppose you are out at Midnight (ignore daylight saving time if it is the Summer). Jupiter will be 4:30 hours or about 67.5 degrees before or East of due South, on a bearing of very roughly 102 degrees from local North.

Declination

The declination chart allows you to read off the declination or celestial latitude of the planet. In the case of Jupiter for day 60 (beginning of March) the declination is 16 degrees South, so Jupiter is 16 degrees below the celestial equator. This means that Jupiter will be low in the sky and may not have risen at midnight.

hohoho

December 10th, 2005

Night photography at Christmas

Out of focus

December 8th, 2005

Strange out of focus image

So far out of focus it looks interesting. You can see the circular field of the lens – the outer parts of the image are very dark. It is a picture of some candles on a table, and the sharp version is boring.