I’m attempting a visual presentation of ratio and percentage problems to see if I can ‘cut through’ some of the verbal issues with the usual story problems you find in textbooks. As the assessment format is problems in words, I’ll need to make the links to these story problems, but I hope that by sorting out the method needed to solve the problems visually first, the students will be able to concentrate on understanding what the question is about. Well, that is the theory!
The pale yellow background and large text are to suit a student with a specific requirement in one of my groups. I might try a ‘slide cast’ in SlideShare, but you have to fiddle with timings for each slide transition so I might talk through the slides in my YouTube format.
Having problems with the side bar in MS Internet Exporer (6.0.2900) on most of the themes I use on this site. I think its because of the YouTube or the ScreenToaster embedded objects. So I’m using a really basic theme.
The screen cam above uses iShowU with commentary recorded directly using the built in microphone on the iBook. I use the 640 by 480 screen setting and set the iShowU preferences to scale the video to 50%. Sound was recorded in default 44.1KHz sampling. The resulting QuickTime movie is around 6Mb in size. I’m just waiting for YouTube to complete processing the video to see if the ‘lag’ between sound and images is still there as it was last time I used the iBook to produce a QuickTime from a Keynote presentation. It isn’t, so I shall stick to iShowU for future screen casts.
“The first effect that I noticed, towards the end of the first week, was an extraordinary intensification of physical sensation. My sense of body temperature became more acute – if I was wet, or cold, or warm, I experienced this very directly and totally. I have never been so physically tired, so aware of weather, of sound, and of the variety of colour in the wild environment. Before long my emotions also swelled into monumental waves of feeling – floods of tears, giggles, excitement or anxiety, often entirely disproportionate to the occasion. It felt normal. These were not new or inexplicable feelings; they were the old ones felt more strongly.”
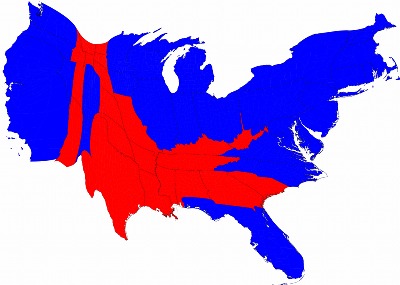
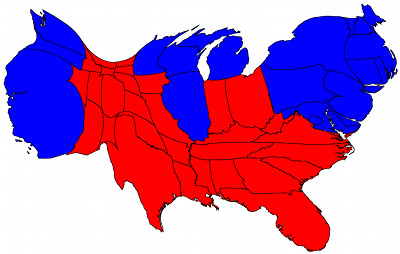
Mark Newman’s maps of the US elections have been scaled so that the area of each state is proportional to the number of seats the state has in the electoral college. He has published the C code he uses to produce the maps from the x,y coordinates of the regions. The maps by county are fascinating and reveal an almost fractal structure in voting patterns.
Weblog-ed is a blog written by Will Richardson, whose book I have just ordered (I admit to the irony – finding out about a print book that explains how to use blogs, wikis, and podcasts from a blog!). Will has posted about the need to involve Web 2.0 tools in the curriculum somehow so younger people know how to develop online presences. Comments are interesting as well.
I’m looking some kind of college wide forums or blogging that will be safe but visible for all students. Maybe I just need to use FaceBook!