August 28th, 2005
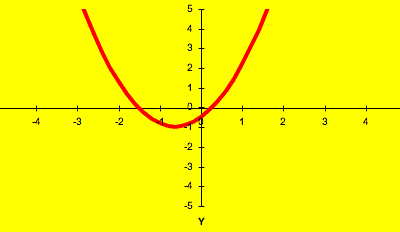
Use the ‘forms’ toolbar in MS Excel to link a slider control with a cell. Then you can make ‘dynamic graphs’. Projected onto a screen, you can ask students to predict what the result of a change is going to be.
You can download a spreadsheet with the straight line graph, y = mx + c, and two forms of the quadratic graph, y = ax2 + bx + c and y = (x + p)2 + q. The second form of the quadratic helps to explain completing the square like problems, and helps to explain how transforming a graph by scaling in different directions can generate any quadratic graph from the basic y = x2.
I use the spreadsheet mainly on a projector in a brief whole class exposition with Access level 2 and GCSE classes. I’d set up (say) a straight line with a gradient of 2 and an intercept of 1, then ask
- what will happen when I increase the gradient…
- and when I increase the intercept….
Next, I have an OHP or a second copy of the straight line worksheet available with a very different graph and ask
- How do I change the gradient and intercept to change the graph on the spreadsheet to look like the one on the OHP?
- What direction and by how much
This all takes about 15 to 25 minutes with directed questioning, examples that include positive and negative intercepts and positive and negative gradients, and a recap. There is then a worksheet with 10 graphs on (copied from the spreadsheet into Word) and the students work in pairs to find the gradient and intercept from the graphs using a simple ‘x step = 1 triangle’ method for the gradient.
I find the projected spreadsheet helps me check the understanding, especially in the negative quadrants (directed numbers being a new concept for most level 2 students). The speed with which new graphs can be set helps people ‘see’ the effect of changes.
If you download the MS Excel spreadsheet here, you will notice that I have fixed the scale on the XY scatter graph that draws the graphs – the graph then moves around a window of definite size rather than having Excel recalculate the scales to fit the data.
Graph plotters like OmniGraph have more advanced and flexible facilities for exploring graphs, and allow you to change the graph formula on the fly, but tend to be harder to set up in my opinion.
Posted in ILT, Maths | Comments Off
August 27th, 2005
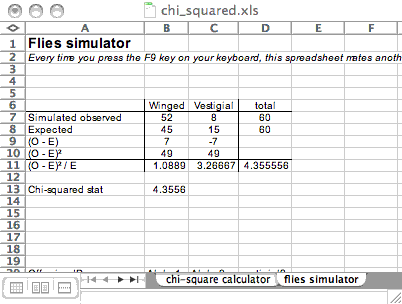
- Download a spreadsheet that simulates breeding 60 fruit flies
- The spreadsheet simulates the results of breeding fruit flies (F2 Generation – Second Filial?) where the expected outcome is a simple 1:3 Mendelian ratio of vestigial winged flies to winged flies
- The screen shot above shows an anomalous result – a chi-squared statistic well above 3.84, the critical value of the chi-square statistic at the 5% probability level with one degree of freedom
- I guess you should expect such an anomaly around 1 in 20 times – just press F9 for another breeding experiment
- The other tab of the spreadsheet calculates the data (I have left out the Yates’ correction usually used with 2 X 1 tables)
You can simulate the breeding experiment using two different coins (1p and a 10p say) – suppose HH is vestigial and HT, TH and TT are all winged, so that H is recessive allele and T is the dominant allele. This simulation can take a few minutes with a class of 15 or so as each person tosses their pair of coint 4 times.
Posted in ILT, Maths | Comments Off
August 26th, 2005

- Mariner Software is a small independent software house that produces small fast programs for the Mac OS
- Mariner Write is a very nice wordprocessor – if all I did was write, I’d use this
- Alas, I have to produce Mathematical formulas, graphs, drawings and tables, and I have to get them over to Windows platforms.
- MS Office is essential given that NeoOffice/J has lingering compatibility problems with OpenOffice on Linux/Windows and Office
Thanks for the TGIF clipart, Logan, and it will brighten up e-mails from now on. Marinersoft are offering a big discount on 5 packs of their products.
Posted in Notes | Comments Off
August 26th, 2005
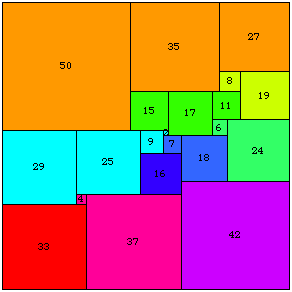
“Can a square be partitioned into a number of smaller squares such that no two of the smaller are the same size? Casual pondering might lead one to think this geometrically impossible. However, in 1939, the first such example was found (R. Sprague, 1939—using 55 squares). Improvements were made by others until, in 1978, it was proven that the “lowest possible order of a perfect square dissection” is 21 (A.J.W. Duijvestijn, 1978).
Artist Eric Harshbarger (a graduate of the Auburn University Mathematics Department, 1992 BS., 1994 MS.) has recreated that unique solution in the adjacent mosaic. By using 21 different colors of LEGO bricks, a different color for each square, he has used the popular construction toy to illustrate the geometry of the problem. Asked to explain his motivation further, Harshbarger expounded:
‘The inherent geometry and squareness of the LEGO bricks very much reinforces the underlying theme of the square dissection problem; it is a natural fit. Furthermore, by employing a material more commonly thought of as a popular toy, I hope to draw the audience closer to the work. Too often Mathematics is not considered ‘fun,’ and yet here we see that it is so closely related to one of the most popular toys of all time.’ “
Posted in Maths | Comments Off
August 25th, 2005
“A student of mine [Guthrie] asked me today to give him a reason for a fact which I did not know was a fact – and do not yet. He says that if a figure be anyhow divided and the compartments differently coloured so that figures with any portion of common boundary line are differently coloured – four colours may be wanted, but not more – the following is the case in which four colours are wanted. Query cannot a necessity for five or more be invented…” Quoted from a letter by Augustus DeMorgan after Francis Guthrie asked about the number of colours needed.
The four colour theorem was the first major theorem to be solved by relying on a computer algorithm (with the provisio that the theorem depends on the compiler not having any logical bugs).
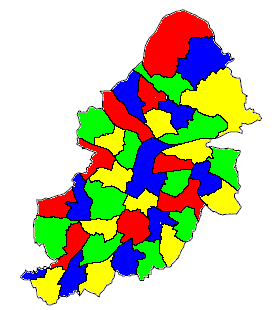
Using one of Eric Harshbarger’s Java applets , I have hacked up a page where you can colour in a map of the new Birmingham City Wards. Actually walking through the colouring of this small map makes you think through aspects of the problem. Quite often, you have to change one of the colours to avoid having the same colours on a boundary Рraising the issue of how many logically distinct colourings can their be for each (finite) map?
Posted in ILT, Maths | Comments Off
August 24th, 2005
Drag and drop puzzles can be created using the wonderful Hot Potatoes quiz generator but that is not the main objective of the package. More flexible pages can be built using ‘canned’ java applets. Javascript can also be used with DHTML divs and layers to create drag and drop functionality.
The sites below contain reusable code
Posted in ILT, Web | Comments Off
August 24th, 2005
Posted in Maths | Comments Off


