PowerPoint timelines

March 12th, 2007

Advanced timeline view in MS PowerPoint 2003 with the names slide

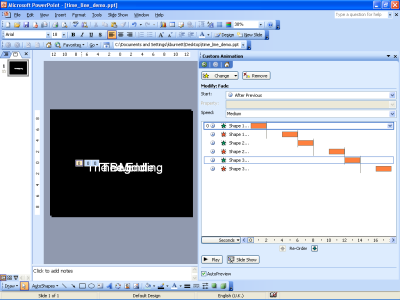
A student taking the English Speaking Board qualification at level 3 wants to cover the ‘reading’ requirement by reading out a statement regarding road deaths caused by speeding. She wants a PowerPoint slide in the background that is displaying the names and dates of children killed by cars.

Download the MS PowerPoint time line demo . I’m using a similar slide to advertise Moodle on a plasma screen that is being installed in the College reception.

We found a way of doing this as follows

  • Create text boxes with names spread around the slide, choose the largest font size that will fit in a nice proportion and use that size for all the boxes
  • For each box, add a Custom Animation for Entrance and one for Exit
  • I like the ‘fade’ effect
  • Right click over the entry for each entrance/exit in the Custom Animation pane and select the ‘on previous’ and the timer button
  • Right click and select the Timer button
  • Set times to 1 sec
  • For each Exit event, add a delay of 1 second

View the slide and make sure that each name fades in for 1 second, remains bright for 1 second and then fades out for 1 second. Then…

  • Select all the text boxes
  • Click on Drawing and Align and Distribute from the Drawing menu
  • Select Align Middle
  • Again select Drawing and Align and Distribute
  • Select Align Center

The text boxes will now overlap each other – while still selected you might want to centre the boxes in the slide.

Test the slide, the result should be each name appearing and disappearing over a three second cycle.

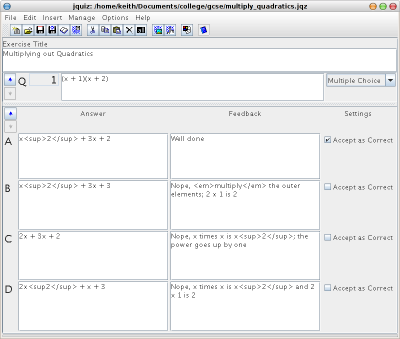
The screen grab above shows the ‘advanced timeline’ view of a sample.

Quadratics

March 11th, 2007

Java version of Hot Potatoes in Linux Xubuntu running under Java 1.5x

Download a Web page containing a Hot Potatoes quiz on multiplying out quadratics.

Download the jqz file used to produce the Web page. This should load into any recent version of Hot Potatoes

The quiz will present a random choice of 10 questions from a bank of 20 questions that I have coded into the quiz. The possible answers for each question will be presented in a different order each time the page is loaded.

Hot Potatoes is a well known suite of quiz generator programs that is available for download and (free) registration. The licence is such that you can use the programs for free without restriction provided you make quizzes available on the Web. I’m using the Maths Quizzes category here to publish my quizzes. The program runs as a Windows executable on Windows, but there is a beta test Java version available for Mac OS X and for Linux. The Java version works fine on Xubuntu provided you have installed a Java run time environment.

BTEC Award Criteria

March 8th, 2007

Whiteboard after planning criteria mapping

The BTEC Award in Applied Science (Forensic Science) Units have been re-written for first use next academic year. The Maths units look to be a significant improvement to me.

EdExcel are making the Units available as a (huge) 600 page download for Award, Certificate and Diploma and all the core and optional units for a range of qualifications.

I spend 10 minutes hacking out just the criteria for the Units available on the Award into a text file and then via Word into PowerPoint with one criterion per slide. We then printed 6 slides to a sheet, cut them up and pasted the criteria to a timeline showing a series of integrated vocational tasks. The year follows the logic of an investigation, and we can see where the criteria fit and which will need to be taught as discreet ‘subjects’.

Note. This material is copyright to EdExcel and possibly individual authors, and if any rights owner objects to my putting the criteria out like this, I will remove the criteria text.

Notation : The number in front of each statement below is the Unit number. The P, M, D letters indicate the grade level, and the trailing number is the BTEC reference number for the criterion.

  • 1P1 outline the key features of the periodic table, atomic structure and chemical bonding and carry out simple titrations and calculate accurate results
  • 1M1 draw conclusions based on the practicals carried out
  • 1D1 explain the use of preparing standard solutions and titrations and describe how this may be carried out differently in industry
  • 1P2 describe, using a light microscope and electron micrographs, the structures and functions of the components of prokaryotic and eukaryotic cells and provide illustrations of types of animal tissue
  • 1M2 explain the importance of cell differentiation in the formation of tissues in eukaryotes
  • 1D2 compare different tissues with similar functions in terms of their structure and functions
  • 1P3 describe the different types of energy and their interconversions
  • 1M3 practically demonstrate a range of energy interconversions with appropriate explanations of the systems investigated
  • 1D3 evaluate the efficiencies of energy conversion systems
  • 1P4 construct simple series and parallel electrical circuits and describe the properties of the main regions of the electromagnetic spectrum.
  • 1M4 describe how series and parallel circuits operate referring to current and potential difference, and explain the applications of the main regions of the electromagnetic spectrum.
  • 1D4 perform calculations on series and parallel circuits, and explain applications that use electrical circuits.
  • 4P1 produce samples of at least two compounds and estimate their purity
  • 4M1 measure the yield and purity in the preparations carried out and describe the factors that influence them
  • 4D1 explain how the highest yield and best purity could be achieved in the preparations carried out
  • 4P2 apply sampling techniques while working safely
  • 4M2 describe the importance of sampling in a specific industrial context
  • 4D2 explain potential sources of error in sampling and describe how to deal with errors
  • 4P3 carry out analytical techniques and report the results accurately
  • 4M3 explain the importance and legal responsibilities of working safely
  • 4D3 explain the importance of working accurately and how accuracy can be ensured in the techniques used
  • 4P4 select and use appropriate instruments to test substances or materials.
  • 4M4 explain the choice of instruments in the practical exercises.
  • 4D4 evaluate the variables in operation of instruments used and how they could be optimised.
  • 5P1 describe the development of one scientific theory, highlighting the processes involved
  • 5M1 differentiate between those questions that science is currently addressing, those that science cannot yet answer and those that science will never be able to answer, giving two examples of each
  • 5D1 explain the necessity for peer-review and why sometimes there is resistance to new scientific theories
  • 5P2 list public concerns about science highlighted in the media and describe two recent cases
  • 5M2 explain whether concerns raised about science in the media are justified by analysing two recent cases
  • 5D2 analyse whether the media makes a positive contribution to the public’s perception of science
  • 5P3 list scientific or technological developments which have raised ethical or moral issues and describe the issues associated with two developments
  • 5M3 explain the progress made by one contemporary scientific or technological advance and analyse the effect on society as it was developed
  • 5D3 analyse the ethical and/or moral arguments associated with two scientific or technological developments and substantiate your own conclusion
  • 5P4 describe five different groups and/or organisations that have a political agenda and their influence on science.
  • 5M4 explain that financial support influences scientific research.
  • 5D4 explain how science can be put to uses other than those originally intended and how this affects either society or society’s perception of science.
  • 6P1 carry out mathematical procedures involving units, numbers, areas, volumes, indices, formulae and equations in a practical laboratory situation
  • 6M1 explain how the use of some operations can give skewed information and how errors may occur
  • 6D1 explain the use of negative indices in the stages of making serial dilutions
  • 6P2 plot and interpret linear and non-linear graphs from primary and secondary experimental data
  • 6M2 explain why different graphs are used to present scientific data and how errors may occur
  • 6D2 evaluate the usefulness of graphs in displaying the results of scientific experiments
  • 6P3 record and display scientific data appropriately, indicating any errors.
  • 6M3 justify the levels of accuracy in the use of particular types of data collection methods in laboratory experiments.
  • 6D3 evaluate the appropriateness of the methods used to record and display data.
  • 7P1 demonstrate the ability to carry out mathematical procedures as a result of practical laboratory work
  • 7M1 explain, using calculations as examples, how indices and logarithms can simplify mathematical procedures when dealing with very large or small numbers
  • 7D1 evaluate, using given examples, the need to use various methods to determine the size and influence of errors on final calculations and conclusions
  • 7P2 demonstrate the classification of data and the correct application of a student t-test to data from a laboratory experiment
  • 7M2 explain, by giving at least two examples involving probability, mutually exclusive and independent events, the addition and multiplication rules and conditional probabilities
  • 7D2 analyse and justify at least two statistical procedures you have used in biology, physics or chemistry experiments
  • 7P3 demonstrate the ability to plot a linear and non-linear graph using scientific data and calculate the rate of change by the most appropriate method.
  • 7M3 explain, using three or more examples, how 2D and 3D structures and their symmetry can be understood and represented diagrammatically.
  • 7D3 evaluate using laboratory-based data the advantages of presenting such data in graphical, numerical or algebraic form.
  • 8P1 use two different statistical techniques
  • 8M1 explain and justify the selection of the two statistical techniques chosen
  • 8D1 justify and explain the sampling process and deductions made in the statistical analysis
  • 8P2 process data from a scientific problem using an equation and a graph to display the results and provide a valid conclusion
  • 8M2 estimate the sources and sizes of the errors and accuracy of the solution
  • 8D2 evaluate the techniques used and the conclusions reached to solve the scientific problem
  • 8P3 use the chi-squared test to support a scientific hypothesis.
  • 8M3 analyse the results of the chi-squared test to make valid conclusions to support the scientific hypothesis.
  • 8D3 evaluate the use of the chi-squared test in making probability judgements.
  • 10P1 outline the structures and processes used by the organisation to produce a product or perform a service, and identify any health and safety issues
  • 10M1 analyse the processes used by the organisation to produce a product or perform a service
  • 10D1 assess the influence of legislation on the processes used to produce a product or perform a service
  • 10P2 describe the role and responsibilities of the scientist/technician in the organisation
  • 10M2 outline typical career development and/or progression for a science technician in the organisation
  • 10D2 analyse the different career paths through the organisation of personnel entering at different levels
  • 10P3 plan and carry out a practical investigation in the laboratory to represent a larger scale industrial process that is carried out by the organisation
  • 10M3 analyse the results of the investigation and explain their contribution to the organisation
  • 10D3 explain how and why the industrial scale differs from the laboratory scale
  • 10P4 describe the statutory and voluntary constraints that may apply to the organisation (and identify the consequences of non-compliance to both the employer and employee).
  • 10M4 analyse systems used by the organisation to ensure adherence to the controls.
  • 10D4 comment objectively on any issues of public concern that may arise from the work of the organisation.
  • 20P1 describe atomic structure, radioactivity, and the production of X-rays and ultrasound
  • 20M1 explain the random nature of decay and how it relates to half-life
  • 20D1 analyse the effect of the operation and design of the tube/head on a typical Xray spectrum
  • 20P2 describe the production and detection of radiopharmaceuticals and the operating principles of the gamma camera
  • 20M2 compare the desirable biological properties and radiological properties of radionuclides used for imaging
  • 20D2 evaluate the choice of radiopharmaceuticals for a range of clinical imaging requirements
  • 20P3 outline the process of magnetic resonance imaging, and the instrumentation and equipment used
  • 20M3 explain the factors influencing signal intensity in MRI
  • 20D3 compare and evaluate the appearance of bone and soft tissue in an MRI scan and a conventional X-ray
  • 20P4 explain the principles and effects of radiation therapy and the equipment used.
  • 20M4 explain how excessive exposure to radiation can cause harm.
  • 20D4 evaluate a range of therapy techniques, types of radiation available and the equipment used.
  • 22P1 prepare and report on one organic and one inorganic substance
  • 22M1 select appropriate apparatus and techniques to prepare inorganic and organic compounds
  • 22D1 evaluate the impact of the sources of error, and propose modifications to the procedure designed to minimise their impact
  • 22P2 isolate and report on one substance from a natural material and one from a synthetic material
  • 22M2 explain the principles of each stage in the isolation of one substance
  • 22D2 analyse the choice of techniques and apparatus used to carry out a separation
  • 22P3 carry out and report volumetric analysis and instrumental analysis to identify cations, anions and simple organic functional groups
  • 22M3 explain the chemical principles underpinning the analytical tests used
  • 22D3 evaluate the effectiveness of instrumental methods of analysis compared with chemical tests to identify organic compounds
  • 22P4 carry out calculations and report on percentage yield and percentage purity for P1, P2 and P3.
  • 22M4 explain the application in industry of percentage yield and percentage purity.
  • 22D4 explain the factors that affect yield and purity in the extraction carried out using appropriate scientific ideas, and suggest, with justification, how they could be maximised.
  • 31P1 describe competing criminological explanations of criminal behaviour
  • 31M1 explain how explanations of criminal behaviour come from different theoretical positions
  • 31D1 explain how realist criminology achieved dominance and how this influenced explanation of criminal behaviour
  • 31P2 describe the arguments about the nature and extent of crime
  • 31M2 explain how different definitions of crime have influenced the nature and measurement of crime
  • 31D2 give reasons why crime definitions and the extent of crime are contested
  • 31P3 describe a range of policies intended to control crime
  • 31M3 explain how different crime control policies are claimed to work
  • 31D3 analyse the differences between individual and social crime control policies
  • 31P4 describe the main changes in penal policy from 1850.
  • 31M4 explain how changes in penal policy are influenced by criminological explanations of crime.
  • 31D4 outline contemporary competing penal policies and evaluate the strengths of their theoretical explanations.
  • 32P1 carry out a forensic examination of a simulated crime scene and gather biological, physical and chemical evidence using appropriate methods
  • 32M1 describe fully the procedures used to gather evidence from a crime scene
  • 32D1 justify the procedures used to gather evidence from a crime scene and show how a systematic application of procedures can minimise the risk of missing forensic evidence
  • 32P2 outline the main techniques used for analysing biological, physical and chemical evidence
  • 32M2 describe fully the main techniques used in the analysis of forensic evidence
  • 32D2 evaluate the techniques used in the analysis of forensic evidence and identify the types of evidence or circumstances in which each might be appropriate
  • 32P3 plan and carry out practical work to analyse biological, physical and chemical evidence that they have gathered
  • 32M3 explain and justify the techniques they have used in the analysis of the forensic evidence they have gathered
  • 32D3 draw valid conclusions based upon the evidence from their forensic examination of a crime scene and present the results appropriately
  • 32P4 report the results and conclusions of a chemical, physical and biological forensic examination.
  • 32M4 defend the conclusions drawn in the report.
  • 32D4 evaluate how the information could be communicated more clearly, including aspects of probability.
  • 33P1 select and use equipment and conditions to make a photographic record to the standard required for use as forensic evidence
  • 33M1 select and explain the equipment and conditions to be used for three given different situations
  • 33D1 compare and contrast various cameras on the market for forensic use
  • 33P2 identify the theoretical principles behind the selection and use of photographic conditions for forensic purposes
  • 33M2 explain the theoretical principles behind the selection and use of photographic conditions for forensic purposes
  • 33D2 evaluate the choice of photographic conditions and techniques for a forensic investigation
  • 33P3 identify the use of 35mm film and digital photography for use in the CJS
  • 33M3 describe the reasons for preferential use of 35mm film or digital photography for use in the CJS
  • 33D3 analyse the advantages and disadvantages of digital photography for use in the CJS
  • 33P4 produce a forensic photographic portfolio of a crime scene to the standard required for use as forensic evidence.
  • 33M4 explain the role played by forensic photographic evidence and its significance.
  • 33D4 explain the content and implications of the images in their portfolio, justifying why they are included.
  • 34P1 describe how three psychological perspectives have been used to explain criminal behaviour
  • 34M1 compare and contrast psychological perspectives used to explain criminal behaviour
  • 34D1 evaluate the usefulness of psychological perspectives in explaining criminal behaviour
  • 34P2 plan and carry out a psychological study into a crime issue and produce a written report
  • 34M2 explain how the results of the psychological study contribute to the understanding of a crime issue
  • 34D2 evaluate the psychological study, comparing the results and conclusions with other reports
  • 34P3 describe how psychology theories have been applied to different issues in the CJS
  • 34M3 demonstrate the application of psychological theories to issues in the CJS
  • 34D3 appraise the application of psychological theories to aspects of the CJS
  • 34P4 describe the influence psychological research has had on aspects of the CJS.
  • 34M4 explain in detail how psychological research has influenced aspects of the CJS.
  • 34D4 evaluate the influence of psychological research on aspects of the CJS.

Leonardo

March 4th, 2007

Leonardo Da Vinci sketch of head with proportions on blue paper

David Reuteler’s Web gallery showing some of the drawings of Leonardo da Vinci has had a stylish re-design. Ruth thinks the black border is competing with the white area containing the thumbnails of the drawings. A quick screen grab and colour fill suggests silver or #cccccc might work better, but these are matters of judgement and choice.

This site presents a useful range of well known drawings in a format that lends itelf to PowerPoint slides and to use in Web pages and student projects.

I have seen the original of these two drawings at The Queen’s Gallery, Holyrood Palace, in an exhibition called The Divine and the Grotesque.

The blue head is around A4 in size, and includes the shoulders and upper torso of the model. I have taken liberties with the contrast of the small version here – the original is on darkish midtone grey-blue paper with ink and black chalk.

The skull cross-section is a detail from a plate that includes two skulls, and I remember the drawing being less burgundy in colour.

Skull cross section drawn in dark red or wine pencil on greyish paper

Lunar eclipse

March 4th, 2007

There was a lunar eclipse last night, and, for once, the sky above Birmingham was clear with the brighter stars visible. We saw the disc of the Moon eaten away slowly, then a light bronze disc with a bright arc near the top at around 10pm on the disc. The Moon emerged from the shadow slowly and became the familiar full Moon. I’d hazard a guess at L4 on the Danjon scale of lunar eclipse brightness, but I might be swayed by the bright sky conditions locally.

I shared my binoculars with a neighbour who was impressed at actually being able to see a planetary event from the sodium light dome of the inner city.

Transit of Venus, Tuesday, June 8th 2004

snap of the 2004 Venus transit projected onto a card through a binocular

On the morning of Tuesday, June 8th 2004, we had a planning meeting with about 30 managers. I am the only person that can remember this meeting. A lot of water has flowed under the bridge since then and a lot of planning meetings have come and gone. I can remember that meeting so well because all through it I was thinking I could be out on the car park with a telescope showing students a rare astronomical event.

I did manage to get a hurried image of the transit at Sunrise by projection onto card through binoculars held in a lab stand (one half with the lids on, x7). Many people have put their pictures of the transit up, and I am confident we don’t have to do any planning around sunrise (04:46 BST ) on June 6th, 2012 when you will be able to catch the end of the next transit. I bet it will be cloudy!

Binomial probabilities

March 3rd, 2007

It is time for the chi-squared test based on a two cell one row table. The data is from breeding experiments with fruit flies (there is a company that supply fruit flies with specified genes for breeding experiments). The F2 generation should produce vestigial winged flies in the ratio 1:3 (corresponding to 0.25 probability of two recessive genes).

I decided to add in calculating the actual probabilities for the various possible numbers of vestigial winged flies, but we limited that to 12 flies. The students tried out the nCr button on their scientific calculators and we had a look at the factorial function and how it ‘blows up’ very quickly with increasing n.

The binomial probability formula is

binomial formula: probability of getting k desired outcomes in n trials

where

  • n is the number of trials (coin tosses or offspring)
  • k is the number of ‘desired’ outcomes
  • p is the probability of a ‘desired’ outcome on a single trial
  • q is the probability of not getting the ‘desired’ outcome on a single trial

The structure of the formula can be chunked as follows

  • pkq(n – k) is the probability of getting exactly k ‘desired outcomes’ – perhaps one route through a huge 12 deep tree diagram
  • nCr is the number of different routes through the tree diagram that have this probability

n = 60 is out of the range that a calculator can handle, nCr becomes too large, but a spreadsheet can calculate the values using =combin(n,k).

Below are the results for tossing a coin and looking for heads (p = 0.5)

plot of the binomial probabilities for various numbers of heads for 60 coins

The green lines show the 2.5% ‘tails’, my argument being that any number of heads between 22 and 36 is consistent with the assumption that the coin is ‘fair’.

Below is a plot of the probabilities for flies with vestigial wings, with p = 0.25

plot of binomial probabilities for various numbers of vestigial winged flies (p=0.25) in 60 offspring

Again, the green lines show the 2.5% tails, and any number of vestigial winged flies between 9 and 21 is consistent with p = 0.25, the Mendelian ratio. The shift in the peak results from the assymetry in the probabilities; for instance, 0.25150.7545 being much larger than 0.15450.7515.

The spreadsheet allows me to change the probability of the desired outcome to p = 0.333 to demonstrate the ‘range of rejection’ for the hypothesis that flies with vestigial wings will occur one third of the time. I understand this to be the hypothesis that some of Mendel’s rivals put forward, corresponding to the assumption that the aA and Aa genotypes were the same, and constituted one equally likely outcome. In the 1840s and 1850s, people would not have been talking about genotypes and phenotypes however.

The students may not have any reason to reject the null hypothesis of no difference between the expected values based on Mendelian inheritance (1:3 ratio) and the observed values. It might equally be the case that the observed values are consistent with the expected values based on a 2:1 ratio with only 60 flies! By pooling the available datasets, they may be able to discriminate between the two hypotheses.

Related links

Digital literacy

March 3rd, 2007

Teaching life-long computer skills in our schools offers further benefit in that it gives students insights that they’re unlikely to pick up on their own. In contrast, as software gets steadily easier to use, anyone will be able to figure out how to draw a pie chart. People will learn how to use features on their own, when they need them—and thus have the motivation to hunt for them. It’s the conceptual things that get endlessly deferred without the impetus of formal education.

From Jakob Nielsen’s view about what young people should learn in School about computers.

Predictably, Nielsen lists search skills and the elements of usability design to his list (and I think he is right). I’d add producing edited sound and video, and being able to produce screens that make sense. I’d also bring back some kind of programming linked to Maths lessons. I learned a lot about Maths once I had access to computer algebra systems at university – I also learned a lot about chaotic dynamics by writing short programs to investigate attractors and iterated systems. A computer can be a ‘mathescope’, like a microscopefor biology or a telescope for astronomy.

The spreadsheet is the most accessible environment for ‘programming’ like tasks (including Nielsen’s concept of ‘debugging’) so watch out for a few investigations….

There needs to be some instruction about networked interactions; security, identity (lots of opportunities for ethics and civics tie-ins there as the legal framework in the UK is a bit odd) and self-presentation through personal Web sites. Forums and wikis could be used as ways of exploring community building – wikis don’t enforce conformity by restricting what you can do, instead you have to negotiate and discuss ground rules and stick to them. Conventions rather than enforced behaviours.

For my adult students, a pressing need is simply how to learn using online systems; VLEs or other resources. Skills in evaluation of the quality of information on the World Wild Web are essential, and so it the self-knowledge to select information that is useful (right level, right topic, some test of learning). That means a transparent discussion of learning theory – or bits of it that are useful at the right time.

Related links (mostly from Dick Sblog)