Drawing…
October 8th, 2008YouTube of Bob Staake at work. Amazing what you can do with blocks of colour. Does this geezer sketch? Daring Fireball again.
YouTube of Bob Staake at work. Amazing what you can do with blocks of colour. Does this geezer sketch? Daring Fireball again.

Bob Staake illustrates children’s books among other commissions. His style has lovely strong shapes and colours. He uses PhotoShop 3.0 and Mac OS 9 in ‘classic’ mode. Does this matter? Would it matter if he used Corel Photo-Draw 4 on Windows 95 provided he could get the drawings off the machine in a format compatible with modern printing? Desktop and laptop computers have been around for a long time now, perhaps they are becoming like tools? [ Via Daring Fireball ]
More than once on internet mailing lists I have encountered people who ridiculed others for asserting that “nearly all x are above [or below] average”. This is a recurring joke on Prairie Home Companion, broadcast from the fictional town of Lake Wobegon, where “all the women are strong, all the men are good looking, and all the children are above average.” And indeed, they can’t all be above average. But they could nearly all be above average. And this is actually an extremely common situation.
The Lake Wobegon Distribution on Mark Dominus’ Universe of Discourse. Skewed and bimodal distributions do crop up and can be important. My students are unlikely to read Garrison Keillor (I will ask just in case) but this kind of writing about statistics helps…
Download a sheet of lattice multiplication blanks. Lattice or Gelosia multiplication has gone down very well this year with Access Maths students. The blanks save a bit of drawing in the sessions.
I’ve noticed that the YouTube above and some of the step by step explanations of lattice multiplication handle the carries in a slightly different way. I’ve mentioned lattice multiplication before but it has really taken off this year.
Download a PDF of a BODMAS quick quiz. Print it out and use in the first ten minutes of the lesson to test how much was absorbed in the last lesson!
The reverse questions help understanding I find. Adult students want to know the reasoning behind the methods.

Does your radio battery last longer if you rest it between uses? This is the question that Steve Reyer asked in the context of his Web page about the first transistor radio (the Regency TR-1).
The image above (from Steve’s site dedicated to the TR-1, and copyright to Steve) illustrates the measuring rig that he devised to explore the question. He has…
My own experience of using a battery powered radio for about half an hour a day tends to support the assertion anecdotally. I’m still on the same set of 6 C cells after two and a half years.
It has to be said that the TR-1 circuit (as shown in the US Patent, from Steve Reyer’s site) has a class A output stage: major inefficiency as the standing current in the circuit had to be set to the maximum output expected into the loudspeaker -probably 50mW or similar

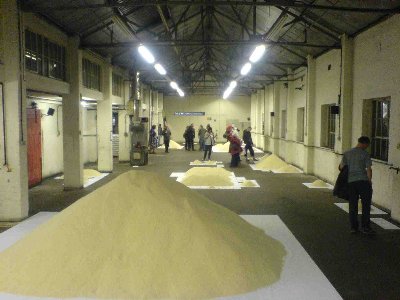
The exhibition Of All The People In All The World by Stan’s Cafe has been touring in various venues around the world and has landed in a disused factory in Birmingham. One person is represented by a single grain of rice. The population of the world will be represented by 112 tonnes of rice, and the population of India represented as rice grains makes for an impressive pile in one of the side rooms.
Stan’s Cafe is actually a theatre company and there are people in character walking purposefully about the factory wearing brown work jackets. There is a table with various weighing scales, and you can suggest statistics on the Web site. I think the best ones will then be weighed out in rice. I’m digging up a few sets of figures to see what happens…

There is an education programme attached to the exhibition and the physical representation of people as rice grains allows comparisons of size. Comparing volumes is notoriously misleading – but the size of the piles of rice appears to bring home the huge disparities in size of various groups of us.