Maps of US election results
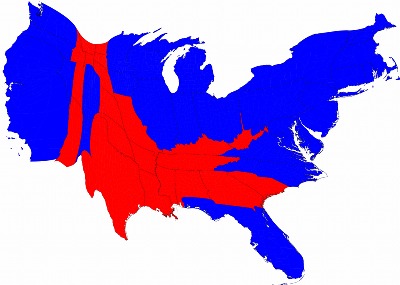
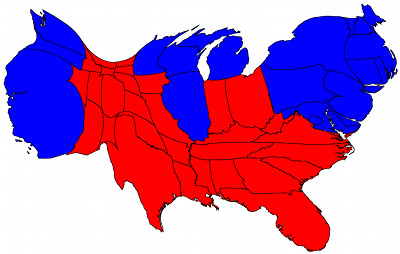
Mark Newman’s maps of the US elections have been scaled so that the area of each state is proportional to the number of seats the state has in the electoral college. He has published the C code he uses to produce the maps from the x,y coordinates of the regions. The maps by county are fascinating and reveal an almost fractal structure in voting patterns.
Jim Ray used a script to automatically capture the front pages of newspaper Web sites as the election day unfolded and the results came in. Nice idea!
Both via Daring Fireball