July 20th, 2005
Maths on the Web is a problem – html entities can provide a limited range of symbols – and I like the immediacy of a blogging approach to Maths. Else it is down to PDFs, or scans, or Whiteboard captures, all of which are clunky and take time and reduce the directness of the blog approach. One day we will move past the ‘glass teletype’ and have some rich symbols.
As you can see in the table below, the WordPress script isn’t picking up the instructions to display the entity mark-up without encoding it. Just ‘view source’ to see the codes. The original table does render the entity codes.
Basically you can do ⟨ α | H | δ ⟩ and √ (a2 + b2) easily but fractions are not widely supported.
Read the rest of this entry »
Posted in Maths, Web | Comments Off
July 19th, 2005
Posted in Photos | Comments Off
July 18th, 2005

Becky – the 15 year old school refuser – came out with a tirade against surveillance and CCTV, ‘eyes everywhere, watching me, always’. She may have had a point.
Every day a spectral ‘me’ walks through the centre of the (recently evacuated) centre of Birmingham, recorded on a score of cameras. I teach live on CCTV (recorded to tape and kept for 30 days) in some of the IT bays as a result of a need for security against vandalism.
Investigators are now piecing together the external biography of four young men from Leeds. We have seen the rucksacks and the t-shirts, but are little the wiser regarding the inside. What is this dredging of the video record actually telling us? Anything useful? Perhaps it is the inside we need to understand – understand, not justify, condone, accept – rather urgently.
Posted in Notes | Comments Off
July 17th, 2005

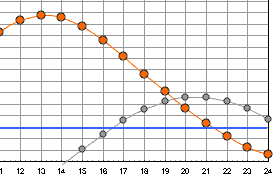
A spreadsheet uses simplified low precision formulas to calculate the altitude of the Sun and the Moon for each hour of a given day .
- Change the latitude to see the effect of moving into the arctic circle
- Change the date to see the effect of slipping towards Winter – note how the mid-day Sun gets lower in the sky
- The thick blue horizontal line represents the horizon, so estimate the times of Sunrise and Moonrise and set
- The vertical gridlines are 6 degrees of altitude apart and -6 degrees of altitude is taken as ‘civil twilight’
- The detail above is set to BST so the Sun is highest in the sky just after 1300 (corresponding to minutes after Noon UT)
- Find a day when the Sun is setting as the Moon is rising – this will always be near full Moon.
- The Full Moon reaches the highest in the sky during winter, when the Sun is lowest
I find an OHP and a globe plus this spreadsheet help liven up an introduction to angles and geometry. Many people have experience of holidays within the Tropics but have forgotten or never learned what the ‘Tropics’ mean. The Arctic circles become meaningful when you can show that the Sun never rises above the blue line in Winter. The detail above shows that full astronomical twilight is never quite reached in the Summer months in the UK.
Posted in Maths, Notes | Comments Off
July 15th, 2005
Arial
“Arial is everywhere. If you don’t know what it is, you don’t use a modern personal computer. Arial is a font that is familiar to anyone who uses Microsoft products, whether on a PC or a Mac. It has spread like a virus through the typographic landscape and illustrates the pervasiveness of Microsoft’s influence in the world.”
And so say all of us. Arial is ubiquitous – like barcodes – so we don’t ask where it came from. But someone drew the font.
Posted in Notes | Comments Off
July 15th, 2005

- Web mail from home
- Access to some blogging systems
- Some VLE functions
- Almost all online exam systems
The ‘privacy’ level selected in browsers can mean that people have to recognise and click on the ‘no entry’ sign in MS Internet Explorer and ‘unblock’ some sites from setting cookies.
Posted in ILT | Comments Off
July 15th, 2005
“Defra said the impact costs per year of food transportation break down as ¬£5 billion due to road congestion, ¬£2 billion due to road accidents, ¬£1 billion due to pollution and ¬£1 billion due to other factors.”
“The report also suggests better monitoring of air transport of food, because it was more responsible for the highest carbon dioxide emissions per tonne of cargo and was the fastest-growing sector.”
The DEFRA draft Food Industry Sustainability Strategy is not apparently available for download as yet and does not appear to be mentioned in the News section of the DEFRA Web site – strange when the BBC appear to have access to the text of the report.
Posted in Maths | Comments Off


