September 7th, 2005

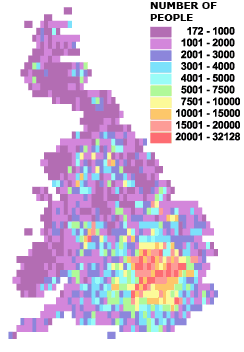
Most people born abroad live in the South of England – especially London. New statistical analysis decouples immigration from ethnicity and focusses on changes between 1991 and now. The map above shows the numbers of people born abroad in various regions – the map has been distorted so that the number of people in each area is the same.
This one has great potential for statistical work – both research on secondary data, careful investigation of the basis of the data, and sampling error
Posted in Maths, Notes | Comments Off
September 7th, 2005
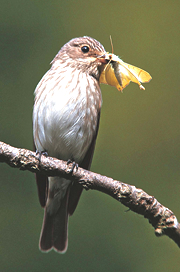
His photographs of the family farm in Austria are especially ‘nice’ if that is the right term.
Posted in Photos | Comments Off
September 7th, 2005
The big three e-commerce sites have moved to home pages with a lot of information and a high link density.
- Analysis of Amazon, Barnes and Noble sites by 2002
- Victor Lombardi analyses the home pages of major e-commerce sites
- He finds much more information on the front pages (5 screens long c.f. one screen long some years ago) and high link density ‘above the fold’.
- Images and links used mainly to convey information
Posted in Web | Comments Off
September 6th, 2005
Chemical reactions in the brain of a baby being born with a shortage of oxygen take some time to generate the damaging chemicals that can cause brain damage and developmental problems. A ‘cooling cap’ slows the build up of damaging chemicals after birth and allows time for remedial action.
Rates of cerebral palsy in babies at risk due to oxygen shortage during birth who were fitted with the cap were found to be cut by half. About 1000 babies are at risk each year in the UK, but this figure is higher in developing countries.
The cap cools the baby’s head by 3 to 4 degrees C. The research sample of 234 babies considered ‘at risk’ was split in half, one group using the new cap for 72 hours with slow rewarming and standard care after that and the other group using standard treatments. 20% of the capped babies showed no improvement – these babies had the most severe oxygen shortage as measured by electrical activity in the brain.
The maths
- Implicit awareness of chemical rate kinetics by the researchers lead to the hypothesis
- Classic statistical trial shows that new treatment is effective
Posted in Notes | Comments Off
September 5th, 2005

The RSPB devised an innovative technique for estimating insect populations – count the splats on the numberplate as you drive in the country. This first survey will provide a baseline for future surveys. The study was prompted by an observant RSBP staffer who noticed that they had less insect splats on their windscreen in the UK than when driving in Europe.
Read the following pages…
Methodology
Read the what do I need to do page on the RSPB Web site and try writing answers to the questions below…
- Why do you think people were asked not to make special journeys to count the insects?
- Given distance travelled, the time taken and the count, what kind of calculation might the RSPB be doing?
- Why do you think the RSPB asked for the time of start and finish to be recorded in the 24h clock? I.E. Why do you think the time of day of the journey was significant?
- Why do the RSPB instructions emphasise the need to record zero counts?
- Why do the RSPB suggest that journeys between 20 and 80 miles might be best? What might happen if people did counts during very short journeys or very long journeys?
Confounding factors
Quotes taken from the Frequently Asked Questions page.
“In trials last year, we found that fewer insects were recorded at speeds under 30-35 mph, and that the number of splatted insects increased with faster speeds. We are keen to try to account for the effect of speed. So we have asked for your mileage and the time you start and end your journey. This will allow us to calculate an average speed for your journey. We will then be able to account for the effect of average speed on the variation in number of splats.”
- Can you suggest a reason for this apparent speed effect?
- Why did the RSPB divide the ‘splatometer’ into 6 squares even though they only need the total number of insects counted?
The repeat – bias?
- Say the RSPB repeat the count in 5 years. Can you think of any kinds of bias that might occur?
- Read the results page on the RSPB Web site. Write a one sentence summary of the results suitable for a local newspaper.
Finally, the results mention one splat every 5 miles on a splatmeter that has an area of about 225 cm2. Can you estimate the number of insects per cubic metre of air?
Posted in Notes | Comments Off
September 4th, 2005

Your turn
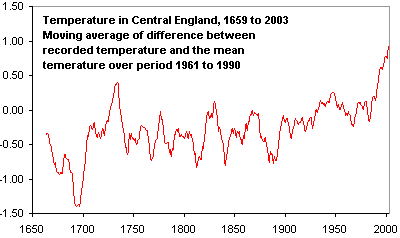
- Download the data from the Environment Agency – it is available as an Excel spreadsheet – and plot your own line graph
- Describe the trend shown in the Excel spreadsheet in words – just a short sentence suitable for a non-specialist audience
Posted in ILT, Notes | Comments Off
September 3rd, 2005
“The ISP reckons that around 1 per cent of its 600,000 or so broadband users are using up to 30 per cent of the available bandwidth during peak hours. ‘We don’t believe this is fair to the vast majority of our customers,’ it said in a statement explaining the changes.”
Posted in Forensic, Notes | Comments Off


