May 6th, 2005
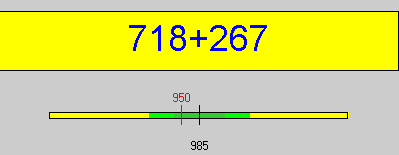
A Java game that pits you against the clock in a game of estimating. Estimation is something people get into a pickle about so a quick burst of this as a warm up in an IT room might get students more ready to make quick guesses. The Java game sometimes gives problems like 567 + 2, but most of the time, they are three full digits in the 100s.
What I like about the game is the combination of working against the clock and being as accurate as possible Рthe points depend on both. This feature of the game play may lead to reflection on the best calculation strategy for a given purpose Рe.g. in a meeting, it might be important simply to know if the total cost of some project is £1000 or £2000, but later, precise costs will have to be recorded.
Posted in ILT, Maths | Comments Off
May 6th, 2005
Got the message?
BBC News election results service provides a timely source of statistics – I’ll try to get the spreadsheet of all the votes as well.
Posted in Notes | Comments Off
May 5th, 2005
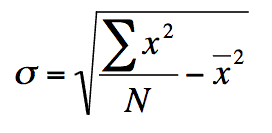
The formula above will give the standard deviation of a set of numbers and saves one column (or one subtraction per data item) compared to the usual one. A disadvantage becomes apparent if you look at a worked example…
Suppose we have a set of 5 heights in centimetres: 160, 158, 162, 169, 155. According to my reckoning, the sum of these heights is 804 cm and the sum of the squares of each height is 129,394 cm2. If I have got those numbers right (it is the morning of a General Election here in the UK) the rest of the calculation follows…
All fine and dandy, but did you notice the part of the calculation that looks like 25878.8 – 25856.64 ? That is two large numbers of similar size, and you are subtracting them. It is really important that you don’t round the mean using this formula.
Now try doing the calculation for this data set: 100160, 100158, 100162, 100169, 100155.
This formula is numerically unstable for data with low percentage variation. Of course, you could always subtract a constant to bring the data back into a range that a 10 digit calculator can cope with. This procedure is called using a ‘false mean’.
Posted in Maths | Comments Off
May 4th, 2005

A BECTa report on the use of Open Source software in 15 schools is due for publication after the general election tomorrow. One open source application I use a lot now is The GIMP , an image processing program similar in function to Photoshop.
There is a binary build of GIMP 2.2.6 for Mac OS X that has been packaged as a regular .dmg file – just download (all 42 Mb), mount the disk image and drag the Wilbur icon to your applications folder. You then authorise the installation in the usual way. GIMP works under X11 and the interface is not elegant and does not follow the Mac conventions, but the software is very effective in use. Scrolling large images can be a bit rough on my iBook G4 but it works.
The Windows installation of 2.2.6 has improved since I last tried to install the application some years ago. You download the GTK+ libraries and then the GIMP itself (12 Mb in total), and you must install the GTK+ libraries first. There is an older build of GTK+ available for Win 98/ME. On my Windows 2000 work computer the installation went fine – but on first load, the splash screen stops at the ‘fonts’ stage for some minutes on the old Pentium 2 box. The Mac OS splash screen shows ‘font caching’ on first load for some 30 seconds but thereafter the application loads in about 15 seconds total (including x11 start up). The Mac OS GIMP installation comes with a script that will switch on ‘focus follows mouse’ under X11. When you point at a window with your mouse, that window takes the focus – no need to click. This is important for GIMP as the image canvas and palettes are presented as different windows. Having to click on a tool twice (once to get focus for tool palette and once to activate the tool) is remarkably distracting. This option is already set on the Windows install.
The manual is similar in style to the manual that comes with many applications – it lists every tool and function. Perhaps more useful is a set of tutorials divided into categories.
In summary, if you make casual use of image processing software and can cope with an interface that is not identical in logic to your Mac/Windows native system, then the GIMP may be a good option.
Linking back to the BECTa press release above, a telling quote is “However it will note wider OSS deployments in schools are still limited by a lack of content-specific applications”. To that I would add the need for solid documentation, tutorials and exercises. I’m already seeing one or two books about Open Office and there is one published book on the GIMP but much more is needed, aimed at different readerships.
PS - I found out about the BECTa report from Seb Schmoller’s excellent fortnightly mailing . If you need to know about ILT, then you should subscribe to this e-mail list. One message most fortnights, text format contents list with links back to the light weight Web page.
Posted in Notes | Comments Off
May 3rd, 2005
There is a simple graphical construction that you can add to estimate a more accurate value for the mode of a grouped frequency distribution (see the red lines on the sketch graph below).
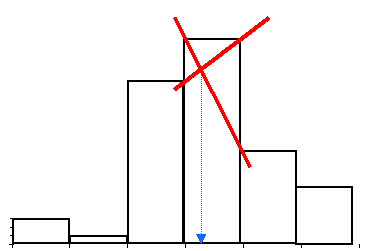
Can you write a formula for the value of the mode estimate in terms of the locations of the bar boundaries and the frequencies of each of the three bars involved?
Read the rest of this entry »
Posted in Maths | Comments Off
May 2nd, 2005
“Within three months of opening up of the Internet kiosk, it was found that the children, mostly from the slum, had achieved a certain level of computer skills without any planned instructional intervention. They were able to browse the Internet, download songs, go to cartoon sites, work on MS Paint. They even invented their own vocabulary to define terms on the computer, for example, “sui” (needle) for the cursor, “channels” for websites and “damru” (Shiva’s drum) for the hourglass (busy) symbol. By the fourth month, the children were able to discover and accomplish tasks like creating folders, cutting and pasting, creating shortcuts, moving/resizing windows and using MS Word to create short messages that too in the absence of keyboard.”
Sugata Mitra, Experiments in New Delhi
Food for thought? We all know that teenagers will teach each other how to use software in Open Access settings – often including workrounds for admin restrictions.
Posted in ILT, Notes | Comments Off
May 1st, 2005
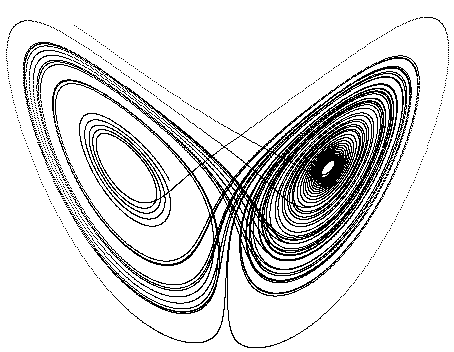
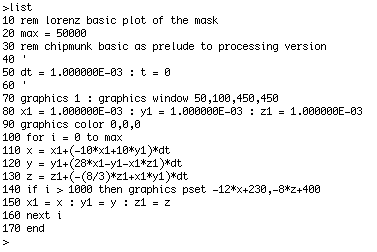
Edward Lorenz was using a primitive computer (it was 1963) to numerically integrate an apparently simple set of coupled differential equations. The computer worked to 6 decimal places and printed out each line to 3 places. Restarting a run, he noticed that the trace started looking similar but became slowly different to a previous run where the computer had not been restarted. Lorenz investigated and realised that the rounding error between restarting with the printed 3 place values and the continuous run 6 place values was sufficient to change the future unfolding of the system completely.
This sensitive dependence on initial conditions is the essence of mathematical chaos – Lorenz later coined the phrase butterfly effect to describe the sensitive dependence on initial conditions that some systems show. The punchline is that you can’t make predictions about the long term future of systems displaying the butterfly effect – the slightest measurement error on your input will lead to totally different values at some definite time in the future, although the system will remain within certain bounds.
Posted in Maths, Notes | Comments Off