Radioactive decay simulation
We did the basic probability lesson this morning. As a follow up, I borrowed the ‘quiet dice’ bucket from the Maths workshop. Quiet dice are dice made of a dense foam spongy stuff. They come in a small bucket with a lid, and when you toss them over the desk surface they make no noise.
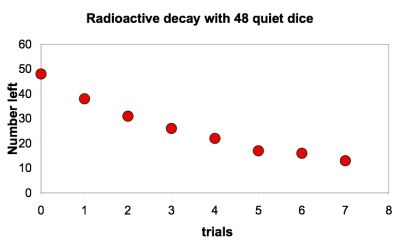
There were 48 dice in the bucket. Students took it in turn to throw the dice and count and remove the 6s. Then the dice are thrown again, and again. A table is plotted into MS Excel on the projector….
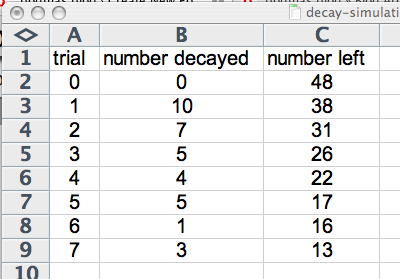
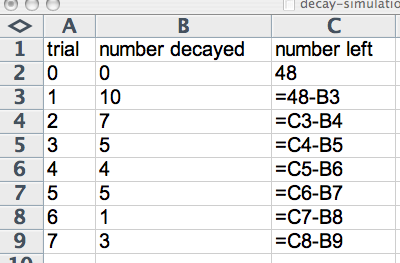
After some discussion we map out the formulas for the last column as shown below – note the starting row and then the ‘subtract the number of sixes seen on this trial from the number left at the end of the last trial’ formula. We added the top row in after the formulas where devised so I missed a trick with the ‘48’ written into a formula as a constant.
After the graph (see top of this post) is plotted, we estimate the half life as around 4 trials. Some discussion about radioactivity, x-rays at the dentist, why it is warmer down a mine than at the surface (these students will be taking a geology Unit next semester) and the rights and wrongs of nuclear waste. All this in about half an hour after the ‘standard’ presentation.