[ home ]

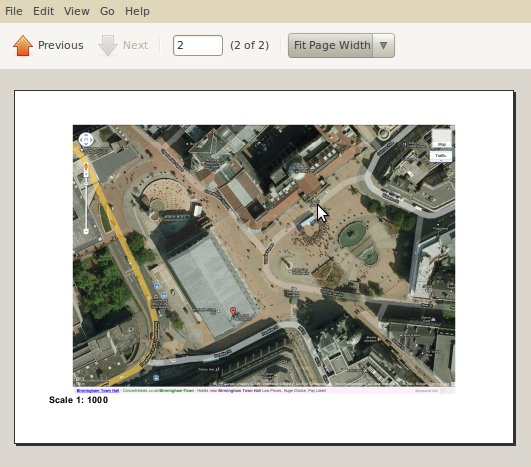
Google Maps and the satellite view make it easy to generate images of the buildings where you teach or other local landmarks. Use the Google Maps 'zoom' feature to frame a place or feature that will interest the students. I've used large area maps showing several Km of a locality leading to scales like 1:30 000, and I've used small area satellite photos leading to scales as small as 1:500. You can screen grab these images, then crop them in a paint program and save the file as a jpg or png file. When cropping the file, make sure you include the scale bar in the bottom left corner.
To make a screen grab in Windows, just arrange the browser window how you want it, and then
In Linux, there is usually a screenshot program included with the desktop, or use the screen shot facility built into Gnu Image Manipulation Program
Then you can 'insert' the image into a wordprocessor. In MS Word and OpenOffice
Now switch back to the image in the wordprocessor file and
You now have an image or plan scaled to an 'easy' number like 1:500 or 1:1000 or 1:30 000
As you can see the Town Hall satellite photo shows a range of shapes and features that can be measured. The Google 'tilt' or perspective effect on the satellite images can provide for discussion around 3-d representation. The 'reality' of the satellite photo also requires students to decide how to measure features. We have estimated the area of lakes using the trapezium method in higher level classes.
Keith Burnett, Last update: Sun Sep 04 2011