[ home ]

Can people pick numbers at random? How can we find out?
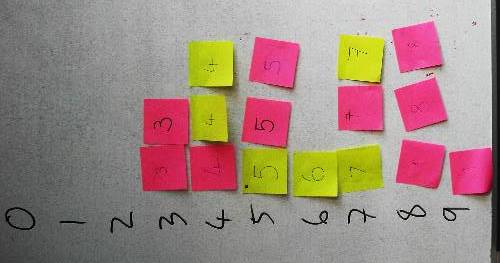
As you can see, I made the 'tally chart' vertical originally and then rotated the image. I wish I had realised that as the sticky notes are uniform in size (and happen to be square) I could build the bar chart directly. I often point out to students when they are doing tally charts that if they turn the tally chart on its side it looks like a bar chart (especially if they have neat writing).
As a simple lesson starter, I asked a group of 16 students to take a Post It note as they came in and pick a whole number 'at random' between 0 and 9 and write it on the note. Just to keep them guessing, I also provided two different colours of Post It note (actually they were the cheaper W H Smiths own brand that come in a stack of different colours). Then they stuck the notes onto a piece of paper that was passed round. Later, while an individual exercise was in progress I set up the histogram. With (say) a foundation class, they could have come up to the whiteboard and built the bar chart.
We had a look at the distribution of the digits; the feeling was that the lower numbers were under represented and that this showed a non-random behaviour. In a later lesson, I produced a handout that ran the students through the Χ2 test...
| Χ2 calculation for the frequencies of the digits | ||||||||||
|---|---|---|---|---|---|---|---|---|---|---|
| Digit | 0 | 1 | 2 | 3 | 4 | 5 | 6 | 7 | 8 | 9 |
| O | 0 | 0 | 0 | 2 | 3 | 3 | 1 | 3 | 3 | 1 |
| E | 1.6 | 1.6 | 1.6 | 1.6 | 1.6 | 1.6 | 1.6 | 1.6 | 1.6 | 1.6 |
| (O - E) | -1.6 | -1.6 | -1.6 | 0.4 | 1.4 | 1.4 | -0.6 | 1.4 | 1.4 | -0.6 |
| (O - E)2 | 2.56 | 2.56 | 2.56 | 0.16 | 1.96 | 1.96 | 0.36 | 1.96 | 1.96 | 0.36 |
| (O - E)2 / E | 1.6 | 1.6 | 1.6 | 0.1 | 1.225 | 1.225 | 0.225 | 1.225 | 1.225 | 0.225 |
So Χ2 = 10.25 if you work out the contributions to three decimal places or 10.68 if you round to two places as some students did. For 9 degrees of freedom and p = 0.05, Χ2 tables give 16.92 as the critical value, so we can't reject the null hypothesis of no difference from the expected frequency of digits.
We concluded that the sample size was too small for reliable results, but that the largest single contribution to the Χ2 total was the three digits that were not chosen. I mentioned the 'Scots verdict' of not proven, and that if Χ2 ≤ 3.325 we might be able to accept the null hypothesis of no difference rather than the statement 'there is no evidence to reject the null hypothesis'.
So in a few minutes in one lesson and a 20 minute exercise in a second, we performed an experiment, collected the data, explored the data qualitatively and then tested an hypothesis, and evaluated the meaning of the statistical test.
Keith Burnett, Last update: Mon Jan 07 2013