
[ home ]
An idea for post 16 Maths for those who have passed GCSE.
August 10th: Have a look at a nice javascript based simulation by krat0sprakhar (HN nickname).
Draw a square of side 1 large unit. Use the bottom left hand corner as the centre of a circle radius 1 and draw the part of the arc that falls inside the square.
The area of the quarter circle is 0.25π square units. Drop rice grains onto the square so that a rice grain has an equal chance of dropping on each part of the square. Count the grains inside the quarter circle, Ni, and the grains inside the square but outside the quarter circle, No. Don't count the rice grains that lie outside the square. For grains that lie accross the circumference, toss a coin to decide if they are inside or outside. You can get an estimate for the value of π using...
π ≈ 4 × Ni ÷ ( Ni + No )
The good news: you can get an estimate of the value of everyone's favourite transcendental number π just by counting! No power series or trigonometry needed. You can improve the estimate by dropping more rice grains and counting them.
The bad news: counting more rice grains takes longer. Counting time is roughly proportional to the number of rice grains you are counting. The estimate improves (as I'll demonstrate below) as the square root of the number of rice grains. Spend 100× as long counting, your estimate is 10× better. There is a trade-off between the counting time and the accuracy you need.
Finding π by counting rice grains is an example of Monte Carlo Analysis [ PDF study notes by Dr Ronald Pevey, a PPT is also available from the same author]. Monte Carlo methods were developed by physicists in a hurry to get reliable numbers. More complex Monte Carlo analysis and simulation is used today in a wide variety of areas including medical physics, economics, and the design of transport systems.
Monte Carlo analysis was developed in the 1950s along with early (valve powered) computers. You can use a computer to simulate dropping the rice grains and to do the counting.
Computers deal with numbers, so you need to describe the dropping of rice grains on a square numerically. Coordinates spring to mind. The square below is about 10cm by 10cm in size I'll just call that one unit.

...I've picked out a couple of rice grains with coordinates around (0.75, 0.27) and (0.65, 0.87). We can see that one is inside the circle and the other is outside, but how does the computer decide? The answer is Pythagoras' result. The one about the sides on a right angled triangle.
The point (0.75, 0.27) is √(0.752 + 0.272) = 0.797 units away from the origin. The circle has radius 1, so that rice grain is inside the circle. The point (0.65, 0.87) is about 1.09 units from the origin and so just outside the circle.
You don't have to take the square root: for a rice grain exactly on the circumference of the circle with coordinates (x, y), you know that x2 + y2 = 1. Taking the square root of a floating point number is an expensive operation for a computer, especially a primitive valve powered one.
To summarise, you just need to generate a lot of coordinates (xi, yi) and then for each coordinate compare xi2 + yi2 with 1. You need a couple of counters: if xi2 + yi2 ≤ 1 then you add one to the Ni counter and if xi2 + yi2 > 1 then you add one to the No counter
We need to produce our virtual rice grains by using a random number for each of the coordinates. We want the random number to be between 0 and 1, and we want the number to have an equal chance of having any value within any small interval within that range. Again, Monte Carlo analysis grew up with the earliest computers and getting a computer to use a deterministic algorithm to produce what look like random numbers turned out be a hard problem. But, the problem was solved, all you have to do now is invoke the rand() function on your spreadsheet or from within your programming language.
Putting all these ideas together, you could write some pseudocode to virtually drop a large number of rice grains and count the ones that landed inside and outside the circle. Actually, I'm cheating a bit by constraining the coordinates of the rice grains so they are bound to land inside the square, so I know the total number Nt of rice grains before I start. I know the rand() function returns a number between 0 and just a tiny bit less than 1 so I used a quarter of a circle inside a square of side 1. That way I can use the rand() function output directly without having to scale it up or anything.
Nt = 10000
Ni=0
For each i = 1 to Nt  # beginning of a loop.
    x = rand()
    y = rand()
    if x^2 + y^2 <= 1 Ni = Ni + 1
Next i                # add one to i and go to start
                      # if i = Nt then drop down to next line
Pi = 4 * Ni/Nt
Print Pi
end
See if you can work out what each line of the pseudocode above does.
You could make a trace table (big in the 1960s) with columns for each of the variables and each row of the table representing another value of i. The trace table below shows the first 10 iterations of the For...Next. Each go round the loop is a line in the trace table. The first column tells you the value of i the loop counter for that row.

I used the random number button on a scientific calculator to simulate the coordinates of the rice grains. In the 10 lines of the table, 7 grains are inside the circle, so π &appox; 4*7 ÷ 10 = 2.8.
See how the Ni count at the beginning of each row is a copy of the Ni figure at the end of the last row? Then each stage of the calculation moves left to right along the row, leading to the comparison of xi2 + yi2 with 1. If xi2 + yi2 is less than one, you increase the Ni count by 1 in the last column of the row. Then the next row starts with the new Ni...
Sounds just like a spreadsheet...
The screen grab below shows a spreadsheet version of the trace sheet. The instructions below will work with LibreOffice Calc and with Microsoft Excel. You can reproduce the trace sheet like the screen grab below by using a few spreadsheet formulas.

In the 20 rows above, there are 17 rice grains inside the circle, giving 4*17/20 = 3.4 as an estimate for π. I just looked at the value of G22, the last count of Ni.
These are the formulas you need to build the spreadsheet...

The first row of the spreadsheet is just headings that are the same as the trace sheet. The first column is the value of the count i.
The second row is iteration 0 (i.e. before the For...Next loop) so cell A2 has value zero. Cell B2 and G2 are set to zero as well.
The third row is the first iteration and has all the formulas you need to produce the rest of the spreadsheet by copying the whole row down. This table explains each of the functions.
| Formulas on Row 3 | ||
|---|---|---|
| Cell | Formula | Explanation |
| A3 | =A2 + 1 | This increases the value of i by one for each row. The value of this cell in each row tells you the number of rice grains dropped up to and including that row. |
| B3 | =G2 | This formula copies the count of the rice grains inside the circle from the end of the row above. |
| C3 and D3 | =RAND() | Puts a random number between 0 and just under 1 in each of the cells. These are the coordinates of the virtual rice grain dropped on this row. |
| E3 | =C3^2+D3^2 | Calculates the square of the distance from the origin for the current rice grain. |
| F3 | =if(E3>1,0,1) | This if statement compares the value of E3 with 1 and returns the value 0 if E3 is larger than 1 and returns the value 1 if E3 is smaller than or equal to 1. I've swapped the inequality round compared to the trace sheet for no particular reason! |
| G3 | =if(E3=1,G2+1,G2) |
This formula adds one to Ni if the rice grain is inside the circle. If the rice grain isn't inside the circle, this formula just copies the old value. I should really have used =if(E3=1,B3+1,B3) for consistency but I forgot. It makes no difference. We could eliminate the B column and incorporate the test for inside/outside with this if formula and eliminate the E column. |
Select the whole row A3:G3 and then mouse over the square blob on the bottom right of the selection and drag down 20 rows to G22.

The formulas should copy down to give values like this (yours will be different because of the random coordinates)...
...and formulas like this...

Try pressing the F9 key on the keyboard to make the spreadsheet recalculate. See how the number of grains inside the circle changes quite a lot? To get a better approximation you need more rows in the spreadsheet...
You could just select row A22:G22 and then use the little square on the bottom right hand corner of the selection to drag down.... and down.... and down...
LibreOffice and MS Excel have quicker ways of selecting cells and copying formulas. The key to selecting a huge cell range is the 'name box' on the top left part of the window under the toolbar. Say the last filled row you made was row A22. Just type the cell range A22:G10002 into the 'name box' like in the screen grab below...

...now press the Enter key and you should see the cell range A22:G10002 become selected as shown in the screen grab below...

...Now press Ctrl-D, that is press the Ctrl key on the left hand side of the keyboard down and hold it while pressing the D key. The entire cell range is filled with the formulas in row A22. In one go. No mouse dragging. Your window might look a bit like this (most of the numbers are random choices)...

To use the select and fill cell range trick the formulas you want to copy must be in the first row of the selection. You can check that the spreadsheet has filled in correctly by typing G10002 into the 'name box' and pressing enter. You can get back to the top of the spreadsheet by typing A1 into the 'name box' and pressing enter. Typing a single cell reference into the 'name box' just jumps your window to that cell.
Now we can drop 10 000 rice grains by pressing F9 but you want to know how many rice grains were inside the circle without looking at cell G10002. Just use a formula somewhere convenient at the top of the spreadsheet...

...Cell I3 has the formula =G10002 to just copy the count of rice grains inside the circle, and cell H3 has a formula to calculate an actual estimate of π as a decimal. Test the formulas by pressing F9 a few times. That will give you a feel for how much variation there is in the approximate value of π.
The spreadsheet works on numbers but to understand what is going on we need some pictures. A graph showing how the approximate value of π improves as the number of rice grains dropped increases might be useful.
To draw that graph add a formula in cell H3 that calculates an estimate for π based on the number of rice grains counted up to and including the current row...

The formula =G3/A3*4 just divides the number of rice grains inside the circle by the total number of rice grains dropped and multiples the result by 4 so we get the estimate of π.
Now copy that formula down 10000 rows. Using the 'name box' trick would work, you could type H3:H10002 into the 'name box', press enter, then press Ctrl-D. There is a quicker way; just click in cell H3 to select it and double-click on that little square in the bottom right hand side of the selection box. The spreadsheet will copy the formula down to H10002. This double-click trick only works when you already have a contiguous column of cells to the left or right of the column you are filling.
Your spreadsheet might look a bit like this...

See how the estimates of π vary in the H column?
The estimate calculated from the first row must be either 0 or 4. That first virtual rice grain has to be inside or outside the circle (our virtual rice grains are very small and the circumference of the circle is amazingly thin). So we end up with 1 ÷ 1 × 4 =4 or we end up with 0.
The second row improves the situation, you can have 0 grains, 1 grain or 2 grains inside the circle giving possible values for the π estimate 0, 2 or 4. Press F9 a few times to see what happens to those first two rows. Try working out the probabilities of those various outcomes for the first couple of rows...
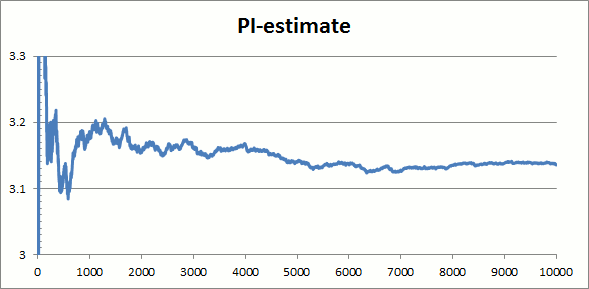
Now we want to draw a graph of the value of the π estimate (column H) against the number of rice grains dropped (column A).
To draw the graph, you need to select the whole of column A by clicking on the A column header (see red circles in screen grab below) and then press and hold the Ctrl key and then click on the H column header. Your window should look a bit like this...

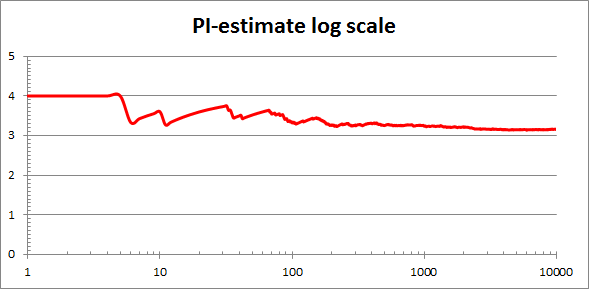
Then Insert an XY scatter diagram. The screen grab below shows you the default chart. Try pressing F9 a few dozen times and see how that graph jumps! The first tenth or so jumps around a lot but the last tenth or so (9000 to 10000 rice grains) is pretty stable.

Some clicking around on the chart (Format X Axis and Format Y Axis and set 'manual' values for the max and min for the scales) gives this zoomed in version...

Try pressing F9 a few times again to get a feel for how the graph moves. Most of the jumping about is in the very first part of the graph. If we could 'spread out' the first part of the X axis you would be able to see the changes more easily. The logarithm function can do the spreading out.
Click on Format X Axis and tick the box to use a logarithmic scale for the number of rice grains. Logarithm in this context means that each factor of 10 occupies the same amount of space on the chart axis, see the screen grab below. You will see an error message about "not allowing 0 or negative values". Set the minimum value for the X axis to 1 to get rid of the error. Play with values of the major unit box to get a nice horizontal scale like the one below...

Press F9 and see how this logarithmic scaled chart changes. I think it gives you a much better idea of how the estimate of π changes for the smaller numbers of rice grains.
I've animated 9 frames each of the log scale graph and the linear scale graph. I find animated GIFs just too annoying embedded in the page so I've linked to them. You can copy those into LibreOffice Impress or MS Powerpoint and they will animate.
Suppose you wanted to investigate the variation in the estimate of π produced from (say) the 10000 rice grain spreadsheet. You could press F9 at least 30 times and write down the estimate each time then look at (say) the median and inter-quartile rage of the 30 results. It would be much easier if the spreadsheet could store the value of the π estimate each time you press F9. You need a macro.
A macro is a list of commands that your spreadsheet carries out in one go. You make the list by starting a macro recorder within LibreOffice and carrying out the commands you want to repeat in the right order. Then you stop the macro recorder then save the macro under a sensible name, and then you associate a keyboard shortcut with the saved macro. When you press the keyboard short cut, the whole list of commands that you recorded is 'played back' in the same order.
LibreOffice can record and play back macros but the commands you record can be keyboard only, it won't record mouse actions except to click in the 'name box', so you have to use keyboard shortcuts to carry out all the commands.
Look at the screen grab of the 10000 rice grain spreadsheet below. In cell J3 I have the number of rice grains inside the circle. In cell K3 I have the π estimate calculated from the number of rice grains. What I want to do is 1) copy those values somewhere 2) press F9 again to get a new estimate 3) repeat step 1).

When working with macros, it is a good idea to 'walk through' the steps a couple of times before starting the recorder. My steps are...

Repeating these steps manually leaves the spreadsheet looking like this...

To record the macro, you start the Macro Recorder by selecting Tools | Macros | Record Macro from the LibreOffice menu bar. A tiny window pops up that says 'Recording'. Repeat all the steps above with the recorder running. Press the Stop button in the little window to finish the recording of the macro steps. When you click Stop, the window shown below appears asking for a name for the macro and where to save the macro to...

I prefer to save the macro to the particular spreadsheet file I'm working on, see how the 'trees' on the left part of the dialogue box above are set up. Click save once you have named your macro. Saving here just puts the macro into the workseet, it does not save your spreadsheet to file.
Associating the macro with a keyboard short cut: select Tools | Customise from the LibreOffice menu bar, and click on the Keyboard tab when the dialogue box arrives.

I hope this dialogue box won some kind of award.
I found it easiest to work in the order shown, starting with the Category list. You have to scroll down to LibreOffice Macros, then click on the little triangles within the list to see the sub entries. When you reach the Macros entry in the Categories list, the DoItAgain macro appears in the Function list. Nothing happens in the Keys list. In the large Shortcut Keys list at the top you scroll around find an appropriate empty shortcut, I went for Alt-C because those two keys are quite close together and I can fat-finger them easily. Then you press the Modify key. Then, finally, the shortcut key combination appears in the Keys list at the bottom right. Click OK and your key assignment is saved with your spreadsheet and should work...
Click in cell J3 then press Alt-C. The spreadsheet should recalculate and you should have a new value stored in cells J4:K4. Click at least 30 times and copy the column of results J4:K33 to another workbook. Once safely copied (and saved), delete the values in J4:J33.
Challenge: Save a copy of the workbook under another name just in case of mishap. Then delete the graphs and expand your worksheet to 100 000 rows (A10002:H100001 then Ctrl-D), adjusting the J3 formula and K3 formula to suit. Re-run the macro at least 30 times so you have a hundred results from the hundred thousand rice grains. Repeat for 1000 grains and even 100 grains.
If you are feeling lucky, try a million rice grains. LibreOffice is slower than MS Excel and you will need plenty of RAM. An i5 laptop with 3Gb RAM managed a 25 second calculation cycle with a 1 million row spreadsheet under Linux. Below is the first few rows from top showing LibreOffice using 1.9 Gb of RAM and 2.1Gb of hard drive swap space as RAM. The amusing thing is that the CPU never goes over 30% while the spreadsheet is calculating.
top - 18:14:16 up 18 min,  3 users,  load average: 0.44, 0.52, 0.44
0.0%st
Mem:   3004244k total,  2811492k used,   192752k free,    61108k buffers
Swap:  6143996k total,     6784k used,  6137212k free,   222468k cached

  PID USER      PR  NI  VIRT  RES  SHR S %CPU %MEM    TIME+  COMMAND
 1317 keith     20   0 2141m 1.9g  60m S    1 66.7   5:34.00 soffice.bin
 1002 keith     20   0  600m 132m 2312 S    0  4.5   0:01.20 mysqld
  986 keith     20   0  360m  90m  30m S    0  3.1   0:08.23
Trying the million row challenge on an older Core-Duo 32 bit laptop with 1.5Gb RAM caused ferocious hard drive swapping and then the operating system asked me to quit LibreOffice. I suspect RAM is the limiting issue. The saved .ods file is 100Mb.
MS Excel can do macros really well. It is famous for the convoluted multiple spreadsheets linked by macros that finance people construct to keep their records and get figures processed. The general approach is similar to LibreOffice above but there are less steps because the process of associating a macro with a keyboard shortcut is built into a single dialogue box.
MS Excel also calculates large spreadsheets more quickly than LibreOffice can. If you are going for the Million Row Challenge, you might find it useful to switch off autocalculate. The control below is found in the Formulas tab in Excel 2010. When you switch off autocalculate, you have to hit F9 each time you want the spreadsheet to update.

The macro tools are in (of all places) the View tab in Excel 2010 (work that one out). As in the LibreOffice macro section it is a good idea to 'walk through' the steps to copy the π estimate and paste the value down the column. I used the same steps as for LibreOffice, except that Paste Special -> Numbers does not shift the cells down, so I did have to Insert | Cells | Shift down as an extra step. The Excel macro recorder does record mouse actions.
Clicking on Record Macro brings up the following dialogue box...

Once you have stepped through the steps of your macro, you have to stop the recorder by selecting it again from the ribbon bar. Then you can click on J3 and run the macro, I used Ctrl-l for the shortcut in Excel.

Recording a macro actually puts some Visual Basic for Applications (VBA) code into your spreadsheet. Code is potentially a security issue, so when you try to save your spreadsheet, MS Excel will warn you with this peerless dialogue box...

...yup, this dialogue box forces you to click 'no' then go back to the File | Save As... menu and manually select a different file type...

Then after wasting a dozen mouse clicks or so you can actually save your work.

Running your macro lets you build up 30 or so results from each different number of rice grains as we did for the LibreOffice macro sheets. Microsoft Excel can handle 1 million row spreadsheets OK on a Dual Core-Duo desktop with 4Gb of RAM, calculation time around 5 to 10seconds - the desktop interface is unresponsive during each recalculation cycle.
If you are planning on taking on the Million Row Challenge, it might be an idea to put the results cells (J3:K3) on a different worksheet within your macro enabled workbook. It transpires that MS Excel 2007 and later allow more than 50 000 rows but apparently they 'scan' all the cells in the current worksheet before shifting the cells you pasted down. Putting the results formulas on another worksheet within the same workbook speeds things up (it works, I tried it).
The screen grab above shows some summary statistics that we can use to investigate the way that the estimated π value improves as you increase the number of (virtual) rice grains. See the next section...
I ran the macro 30 times each for spreadsheets with 100, 1 000, 10 000, 100 000 and 1 000 000 rows each and I copied the results to another spreadsheet below...

The 'summary statistics' at the bottom of the table include the mean and the standard deviation of each set of 30 estimates. The standard deviation provides a measure of the variation in that set of estimates, so it gives us an idea of how much uncertainty there is in the estimate. Tabulating the standard deviations for each number of rice grains gives this table...
| Number of rice grains and the standard deviation | |
|---|---|
| Number of grains (rows) | Standard deviation |
| 100 | 0.1634 |
| 1 000 | 0.0537 |
| 10 000 | 0.0183 |
| 100 000 | 0.0058 |
| 1 000 000 | 0.0018 |
As the number of virtual rice grains grows, the standard deviation falls, so there is less uncertainty in the π estimate. It isn't a simple inverse proportion however. Compare the standard deviation for 1 000 and that for 100 000 results. The standard deviation for 100 000 results is roughly 10 times smaller, not 100 times. Below is a plot of the standard deviation (Y axis) against the reciprocal of the square root (X axis) of the number of rows in each of the spreadsheets...

A pretty good correlation. If you zoom into the origin a little and examine the first three points, you will find more scatter than is apparent here. But there is clearly a theory underlying this. Google the Law of Large Numbers or the central limit theorem if you want to explore further.
Monte Carlo analysis allows us to run the 'virtual rice grain' experiment once and not thirty times and calculate a good figure for how accurate the results will be. Look at Ronald E Pevey's study notes for more detail.
In this page, I've tried to show how you can take a physical situation and model it with just numbers, and how you can use a computer to handle the numbers. There has been a fair amount of spreadsheet use, especially how to manage and work with a large spreadsheet. I've also looked at how to use a graph to visualise what is happening, and very briefly how to choose axes on a scatter diagram to show the functional form of an underlying variable. Along the way, I introduced the use of the mean and standard deviation of a set of results (the repeated π estimates from each size of spreadsheet) and I mentioned the law of large numbers. Each one of these topics could stand further exploration.
Keith Burnett, Last update: Sat Aug 2nd 2014