[ home ]
One class I teach has a number of students taking the GCSE exam at the higher level along with students entered at the foundation level. Meeting the needs of this group has lead me to use workshops for extended parts of the lesson.
Extra graph topics at Higher include graphical solution of simultaneous equations, graphical inequalities and puzzle questions asking you to show that two straight lines are parallel. There is more emphasis on the formula based straight line graph questions compared with the foundation level. Foundation level has functional maths questions about phone tariffs and distance time graphs. Students have to be careful to actually answer the question.
I decided to run a workshop style lesson with students working in level based groups from a series of worksheets while I coached. It is a fairly small class (common in adult education settings because of room size limitations), so there was enough time to talk to individuals. I needed to provide worksheets and activities that students could access directly, so that I could coach rather than explain. I planned to round the session off with a pairs activity where students sort cards holding examples of straight line graphs.
A set of five handouts for the students entered at foundation level
Finally, a set of graph cards and a question sheet about the cards.
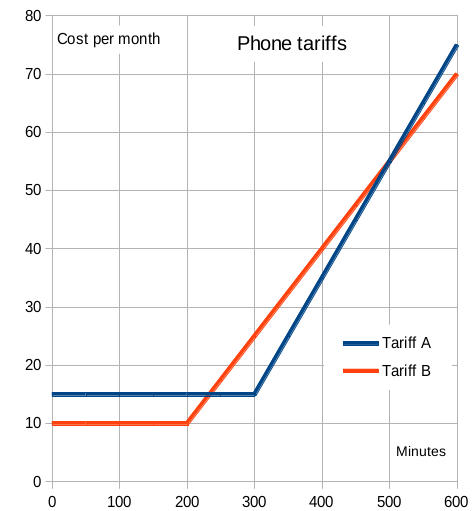
To kick off, I used some GCSE practice paper questions about mobile phone tariffs. I made up the graph above to use later with an interactive whiteboard. The exam questions included
Most students looked at the cost of 100 or 200 extra minutes to find the cost per extra minute. That lead to a link with steepness and cost per unit. Formulating the answer to the question about when tariff A is cheaper than tariff B leads on to inequalities and the idea that there may not be a 'cheapest' company.
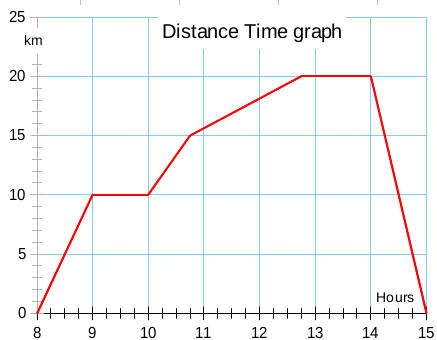
I made up the distance time graph above for an interactive whiteboard slide. The exam questions involved
I had to mention decimal hours, e.g. 3.45 hours is 3h 27 minutes and 3:45h is 3.75 hours. Scale reading is important as well, scales seen on exam questions include 10, 15 and 20 minutes per square.
Again making a link between steepness of the graph and speed helps to make the idea of the gradient of a line familiar and gives practice in finding the values using triangles drawn on the graph. The average speed question did raise the idea of just taking the 20km and dividing by the total time, 4.75 hours.
The students worked through the various activities for about an hour. I sat the higher level students together and let them loose on the handout. Some useful peer interactions did occur. I was able to move about and coach through the tasks, spending most of my time with the foundation students. Students were drawing directly onto the prepared grids on the handouts saving time, and many were making notes about things they found hard on the sheets.
A few points that stuck in my mind about the new higher level handout
The foundation level handouts are a bit wordy and need editing. The sticking points involve symbolising the results of plotting the graphs...
The graph cards are printed 4 to a side and laminated so each pair of students has a set of 8 cards. The first four cards are positive quadrant and the last four are all four quadrants. The questions are designed to help students organise their knowledge of the straight line graph. I think I'll just give the cards out first and ask students to classify them into four classes as
and then get going on the question sheet in pairs.
Keith Burnett, Last update: Sun Feb 03 2013