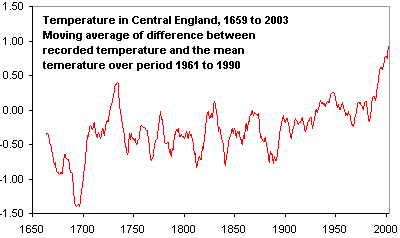
Central England Temperature

- The Hadley Centre for Climate Prediction and Research keeps records on the average temperature for Central England
- Central England Temperature is representative of a roughly triangular area enclosed by Bristol, Manchester and London
- The centre has established a record extending back to 1659 with monthly figures
- A data set showing an 8 year moving average of differences from the mean temperature in the period 1961 to 2003 is available for download from The Environment Agency
- More details of the CET are available from The Climatic Research Unit, University of East Anglia
- A table showing monthly temperatures from 1990 is available on the CRU Web site
Your turn
- Download the data from the Environment Agency – it is available as an Excel spreadsheet – and plot your own line graph
- Describe the trend shown in the Excel spreadsheet in words – just a short sentence suitable for a non-specialist audience