Formula for mode
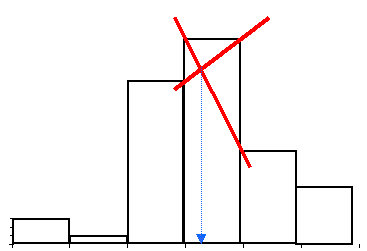
There is a simple graphical construction that you can add to estimate a more accurate value for the mode of a grouped frequency distribution (see the red lines on the sketch graph below).

Can you write a formula for the value of the mode estimate in terms of the locations of the bar boundaries and the frequencies of each of the three bars involved?
Answer goes here next week sometime ![]()